Browse categories
Explore
Fiverr Pro
English
$
USD

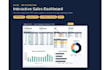
Turn your Excel data into a clear dashboard for tracking sales, inventory, expenses or business performance.
Basic improves one existing dashboard sheet, including formatting, formula fixes and up to 2 charts. Standard creates one dashboard page with KPI cards, pivot tables, slicers and up to 6 charts. Premium includes up to 3 dashboard pages and a guide for updating the reports.
You receive an editable Excel workbook. Refreshable reports use the agreed data layout; you may need to select Refresh All after adding data. Live connections, unattended automation and VBA macros are not included unless agreed separately.
Please send your Excel or CSV sample, required KPIs, preferred layout and Excel version before ordering. I will confirm compatibility and scope before starting.
Revisions are limited to those listed in your package and cover the agreed requirements. Additional data sources or new features can be quoted separately.
Excel Dashboards, Data Cleaning and PowerPoint Design
Languages
What do you need from me to start?
Your Excel or CSV file (or sample data), the KPIs or results you want to see, and any example or layout you like. If you are not sure, message me and I will suggest a layout.
Will I be able to edit the file myself?
Yes. You get a fully editable Excel file with visible formulas, and I explain how to add new data so the dashboard updates.
Which Excel version do you use?
I work in Excel 365. Please tell me your Excel version and whether you use Windows or Mac before ordering. I will confirm which formulas, slicers and refresh features are supported. Google Sheets work requires a separate scope check.


