I will create professional charts and data visualizations by python

P
pinsara_anu
P
pinsara_anu
Pinsara Anuradh

About this gig

Do you have CSV or Excel data but need clear and professional charts to understand your data?


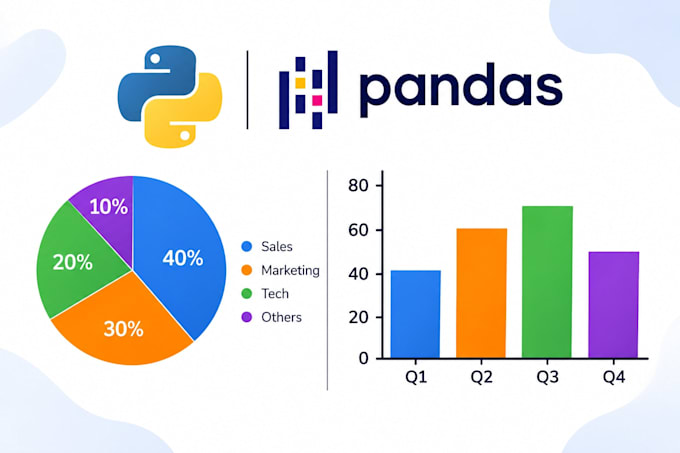
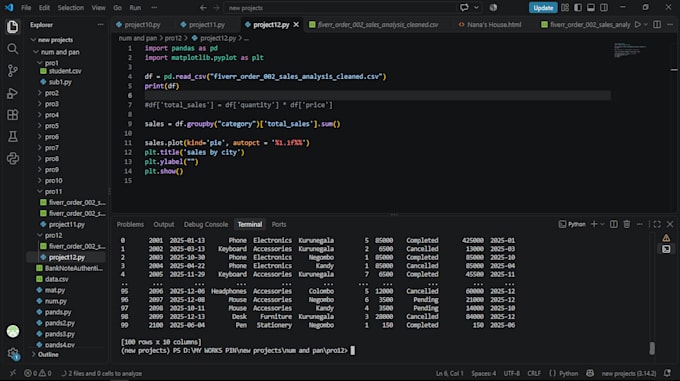
I will create professional data visualizations using Python, Pandas, and Matplotlib to help you understand your business data


My Services:

  • Professional Bar Charts
  • Pie Charts
  • Line Graphs
  • Sales Charts
  • Product Performance Charts
  • Category-wise Sales Visualization
  • Monthly and Yearly Sales Trends
  • Data Visualization from CSV and Excel files


What You Will Receive:

  • High-quality chart images (PNG)
  • PDF presentation (depending on package)
  • Excel report (Premium package)
  • Clean and understandable visualizations
  • Professional service and communication


What I Need From You:

  • Your CSV or Excel file
  • A short explanation of what you want to visualize
  • Any preferred chart styles or colors


Let's turn your raw data into meaningful visual insights!


Get to know Pinsara Anuradh

Pinsara Anuradh

Data Cleaning and Excel Automation Specialist

  • FromSri Lanka
  • Member sinceJan 2026
  • Avg. response time1 hour
  • Languages

    English
Welcome to my profile! I am a Python and Excel Data Specialist focused on transforming messy datasets into clean, error-free files.​If you have unorganized CSV files, incorrect date formats, missing values, or duplicates, I can streamline your data using Python (Pandas) and Excel. Services: 1.​Python Data Cleaning: Handling missing values, duplicates, and text strings using Pandas. ​ 2.Format Correction: Fixing datetime parsing and data errors. 3.​Excel & CSV Processing: Structuring and merging files for analysis.

My Portfolio