Browse categories
Explore
Fiverr Pro
English
$
USD


Service Overview
Who This Is For
What You Will Receive
What You Need to Provide
Note
Ready to start? Place your order or send a message for custom requirements
Bringing science and satellite data together for your goals
Languages
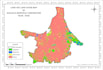
What is Land Use Land Cover mapping?
LULC mapping is the process of classifying each pixel in a satellite image into a land cover category such as forest, water, agriculture, or built-up area. The result is a color-coded map that visually shows how land is distributed across your study area.
Which satellite data do I use?
I primarily work with Landsat 7/8/9 imagery, both of which are freely available. These are widely accepted in academic and professional contexts. If you have your own Landsat satellite data, I can work with that as well.
What software do I use?
I use QGIS, ArcGIS, and Google Earth Pro for processing and classification. Outputs are delivered as standard image files that can be opened in any GIS software or viewed directly as a PNG.
How accurate will the classification be?
Accuracy depends on the quality of available imagery and the complexity of the landscape. I perform a formal accuracy assessment for Standard and Premium packages and report the overall Accuracy percentage and Kappa Coefficient so you can judge the reliability yourself.
My study area is very large. Is that a problem?
It depends on the size. For district or regional level areas, there is no issue. For very large areas such as entire states or countries, please message me before ordering so I can confirm scope and adjust the timeline if needed.
Can I do this for historical years like 2005 or 2010?
Yes. Landsat archive data goes back to the 1970s. As long as cloud-free imagery is available for your area and period, historical analysis is possible.
Will the map be suitable for a research paper or journal submission?
Yes. Maps are exported at high resolution with proper cartographic elements including a legend, scale bar, north arrow, and projection information. They meet standard requirements for academic publication.
Can I request edits after delivery?
Yes. Each package includes a set number of revisions. Revision requests must relate to the original scope of work. If you need changes beyond the agreed scope, a small additional fee may apply.
Do I need any GIS software to view the files?
No. All outputs are delivered as PNG files which can be opened on any computer without any special software.


