Browse categories
English
$
USD
Connect to your AI
Data Analyst, Data Visualization Specialist, Excel, Power BI
Do you have sales and marketing data but no clear picture of what is working? I can help.
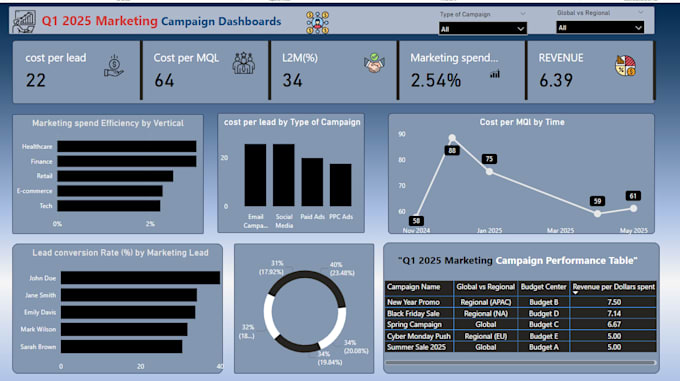
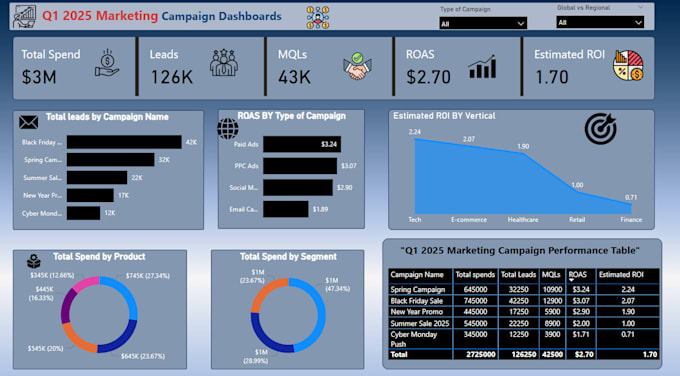
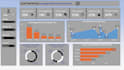
I turn your Excel, CSV or Google Sheets data into a clean, interactive Power BI dashboard, so you can see your numbers at a glance and make decisions faster.
What you can track:
What is included:
How it works:
I have built 26+ Power BI dashboards, and I keep my communication clear and simple, so you always know where your project stands.
Not sure which package to choose? Send me a message with a short description of your data, and I will suggest the best option
What data formats do you accept?
I work with Excel, CSV, and Google Sheets files. If your data is in another system, send me an export and I will check it.
Do I need Power BI to open the dashboard?
Yes, you need the free Power BI Desktop to open the .pbix file. I can also share screenshots or a short video of the dashboard.
What do you need from me to start?
Your data file and a short list of the 3 to 5 numbers you want to track, for example revenue, leads, or conversion rate.
Can you add more pages or KPIs later?
Yes. You can add an extra dashboard page, metrics, or segments from the Extras list, or message me and I will make a custom offer.
Is my data kept private?
Yes. I use your data only for your project and will not share it with anyone.