Browse categories
Explore
Fiverr Pro
English
$
USD
DevOps Engineer AWS EKS CI CD and GitOps
Want to monitor your Kubernetes or EKS cluster with proper dashboards and alerts?
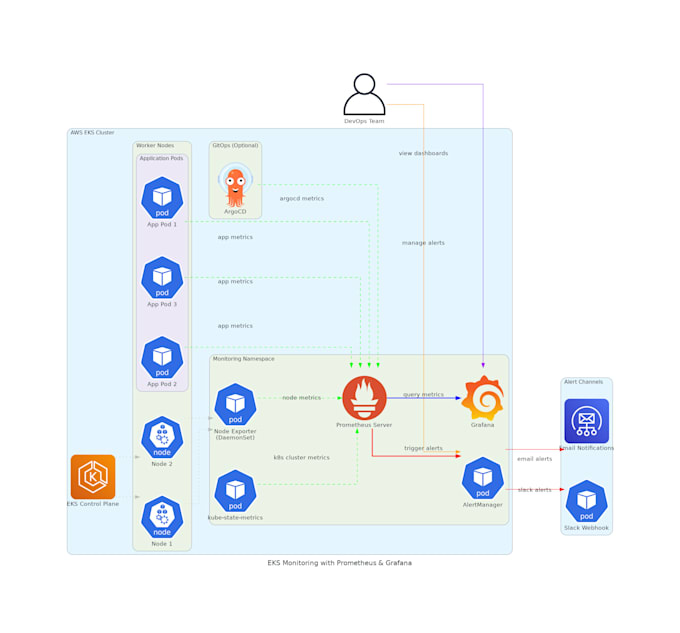
In this gig, I'll set up Prometheus and Grafana to track your cluster's health, resources, and workloads. You'll get dashboards for CPU, memory, pods, and nodes plus alerts via email or Slack when something goes wrong.
What's included:
This setup gives you visibility and alerting to catch issues early and stay in control. It's perfect for production or staging clusters.
I'll also include a short guide so you can manage or extend it yourself.
Feel free to message me if you need something specific or have any questions. I'll be happy to help.


Tools:
Kubernetes
•
Docker
•
Amazon EKS
•
Other
Frameworks:
Other
Cloud Provider:
Amazon Web Services
Programming language:
Python
•
Java
•
JavaScript
Expertise:
Installation
•
Development
•
Configuration
Do I need to have a Kubernetes or EKS cluster already set up?
Yes. This gig assumes your cluster is already running. If you don’t have one, check out my EKS setup gig.
Can I get alerts via email or Slack?
Absolutely! I’ll configure AlertManager to send alerts to your preferred channel.
Will you include ArgoCD monitoring?
If you’re using ArgoCD, I can add a dashboard for it — just let me know when you order.
Will I get documentation after the setup?
Yes, I’ll share a short guide so you can manage or extend the setup easily in the future.