Browse categories
Explore
Fiverr Pro
English
$
USD

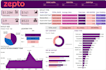
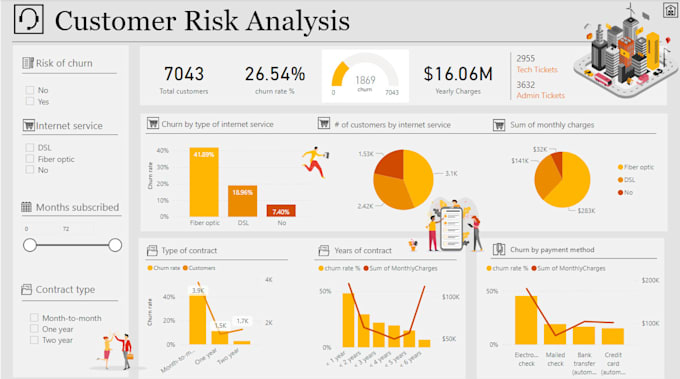
I will make dashboard ,charts, data-visualization in powerbi tableau excel google-sheets
Please contact before placing the order
Transform Your Data into Insights with Stunning Visuals!
Are you struggling to interpret your data? Let me help! I specialize in creating interactive dashboards and data visualizations that make complex data easy to understand and act upon.
What I Offer:
Interactive Dashboards: Designed with Power BI, Tableau, or Excel, tailored to your goals, featuring real-time insights and user-friendly filters.
Customized Visuals: Bar charts, line graphs, pie charts, heatmaps, and more, highlighting KPIs and trends.
Data Cleaning: Preparing accurate, clean datasets for impactful visualizations.
Business Insights: Data-driven visuals to inform decisions in sales, marketing, HR, or operations.
Why Choose Me?
Proficiency in Power BI, Tableau, and Python visualization libraries.
Tailored solutions for businesses, startups, researchers, and individuals.
Accurate, timely delivery with top-notch quality.
Provide your raw data and goals, and Ill craft visuals that drive results. Click Order Now or message me to discuss your project!
Languages