Browse categories
Explore
Fiverr Pro
English
$
USD
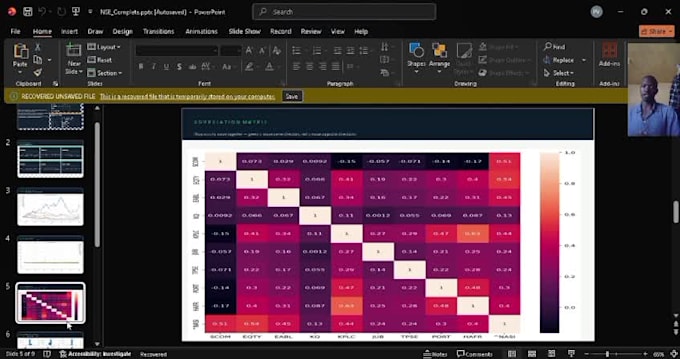
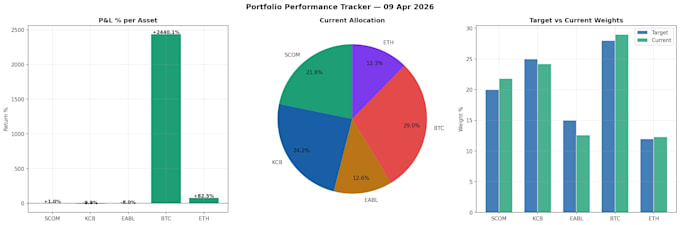
Finance Data Analyst SQL, Python, Tableau Machine Learning for Business Insig
I provide professional financial data analysis and visualization to help businesses, investors, and entrepreneurs make data-driven decisions. I create interactive dashboards, perform predictive modeling, sentiment analysis, data segmentation, and offer optional portfolio optimization for smarter investment decisions.
Whether you need basic charts, detailed dashboards, or advanced analytics, I deliver clear insights and actionable recommendations.


What types of financial data can you analyze?
I can work with company financial statements, investment data, stock market data, budgets, and other business financial data.
Which tools do you use?
I use Excel, Python, and data visualization libraries to create clear dashboards and charts.
Can you create predictive or sentiment models?
Yes! I can build forecasting models, sentiment analysis, and data segmentation to give deeper insights.
How many revisions do I get?
A: Revisions depend on the package: Basic: 1 revision Standard: 2 revisions Premium: 3 revisions You can also purchase additional revisions if needed.
Can I get my work faster?
Yes! You can choose Extra Fast Delivery for quicker turnaround.
Do you provide insights and recommendations?
Absolutely! All dashboards include key insights and actionable recommendations for your business or investment decisions.
Can you handle multiple scenarios?
Yes, I include default scenarios per package and you can purchase additional scenarios if you want to explore more outcomes.
Do you provide portfolio optimization?
Yes! Optional portfolio optimization is available in the Premium package to help maximize returns and minimize risk.