Browse categories
Explore
Fiverr Pro
English
$
USD
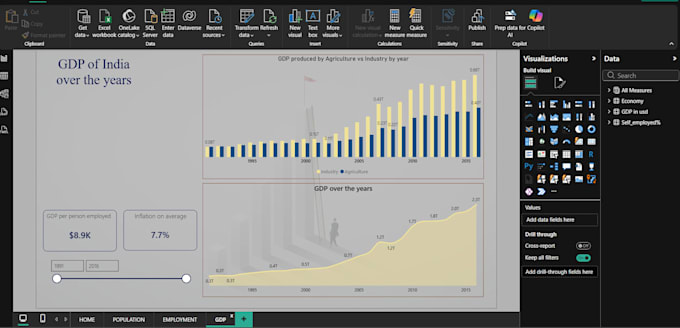
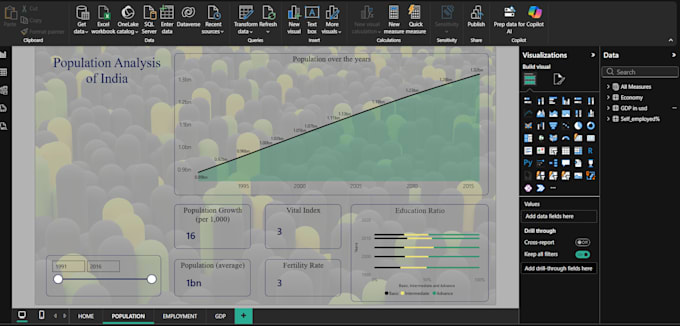
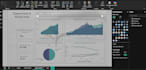
Are you looking for a clean, professional Power BI dashboard or data analysis that actually helps you understand your data?
I help transform raw data into clear insights using Power BI, SQL, Excel, Tableau, Google Sheets, and Looker Studio. My focus is not just creating charts, but solving problems using structured analysis and effective visualization.
You will get dashboards that are easy to understand, visually clear, and useful for decision-making.
Services I offer:
Power BI dashboard creation
Data analysis using SQL or Excel
Data cleaning and transformation
Interactive visualizations
KPI reports and insights
Data interpretation and summary
Why choose me:
Clear and logical dashboards
Focus on meaningful insights, not just visuals
Strong problem solving and analytical thinking
Attention to detail and structured approach
Reliable communication
I can work with different types of datasets including business, sales, finance, and general data.
If you are unsure which package fits your needs, feel free to message me before ordering.
What data formats do you accept?
I can work with Excel, CSV, Google Sheets, SQL databases, and other structured datasets.
Can I create interactive dashboards?
Yes, I can create interactive dashboards with filters, slicers, and clear visualizations in Power BI and other tools.
Can I clean and prepare messy data?
Yes, I can clean, structure, and transform raw data before creating dashboards or analysis.
What do you need from me to start?
Dataset, requirements, and any specific questions you want the dashboard or analysis to answer.
Can I explain insights from the data?
Yes, I can provide a clear summary of key insights to help you understand trends and patterns.