Browse categories
English
$
USD
Connect to your AI
Data Analyst and Business Intelligence Specialist
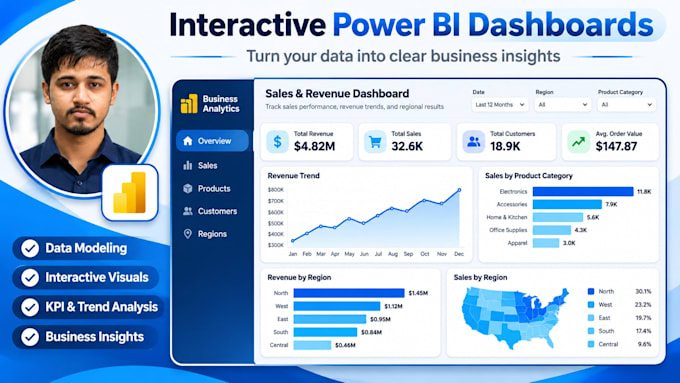
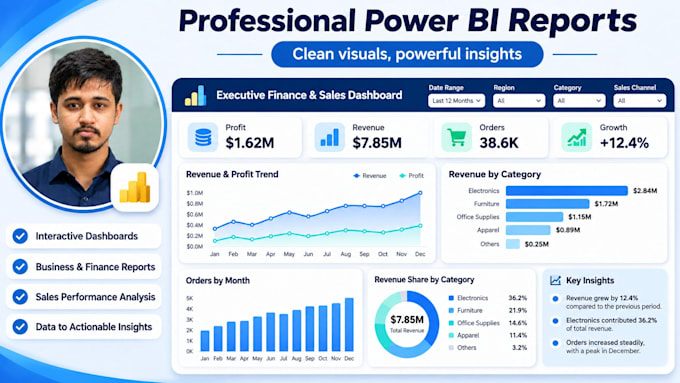
Are you looking for an interactive Power BI dashboard to understand your business data and make better decisions?
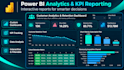
I will create professional and interactive Power BI dashboards using your Excel, CSV, or other structured datasets.
My Services Include:
What You Will Get:
Why Choose My Service?
Before Ordering: Please contact me if your project requires complex data processing or advanced functionality so we can discuss the requirements first.
Let's turn your data into meaningful business insights!


Expertise:
Business Insights
•
Trends
•
Statistics
Technology:
Power BI
•
Power Query
Programming language:
Python
•
SQL
•
DAX
What type of files do you accept?
I accept Excel (.xlsx, .xls), CSV, and other structured datasets compatible with Power BI.
Can you clean and transform my data?
Yes. I can clean, organize, and transform your data using Power Query before creating the dashboard.
Will I receive the Power BI source file?
Yes. You will receive the Power BI (.pbix) file along with the completed dashboard.
Can you create interactive dashboards?
Yes. I can include slicers, filters, charts, KPIs, and interactive visualizations.
Do you work with business datasets?
Yes. I work with sales, finance, e-commerce, marketing, and other business datasets.