Browse categories
Explore
Fiverr Pro
English
$
USD
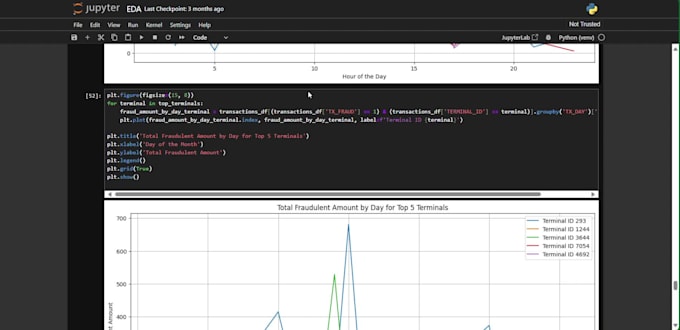
I provide structured data analysis and visual reporting tailored to your specific needs. My focus is to help you understand your data better by identifying key patterns, summarizing insights, and presenting results in a clear and actionable format.
Based on the package you select, the service may include:
I work with tools including Excel, Google Sheets, Python, Power BI, Tableau, and Looker Studio. The final output will be structured, easy to interpret, and aligned with your project goals.
If you're not sure which package suits your needs best or have specific requirements, feel free to reach out before placing an order.


What kind of data can you work with?
I can work with structured data from Excel, Google Sheets, CSV files, databases, or platforms like Power BI, Tableau, and Looker Studio. If you're unsure, feel free to send a sample first.
What tools do you use for data analysis and visualization?
I use tools such as Python (Pandas, Matplotlib, Seaborn), Excel, Google Sheets, Power BI, Tableau, and Looker Studio depending on your preference or project needs.
Can you handle sensitive or confidential data?
Yes, I treat all client data with strict confidentiality and do not share or reuse any data or project details.
What if not sure which package to choose?
You're welcome to message me with your requirements before placing an order. I’ll be happy to suggest the most suitable package or customize one for you.