Browse categories
Explore
Fiverr Pro
English
$
USD


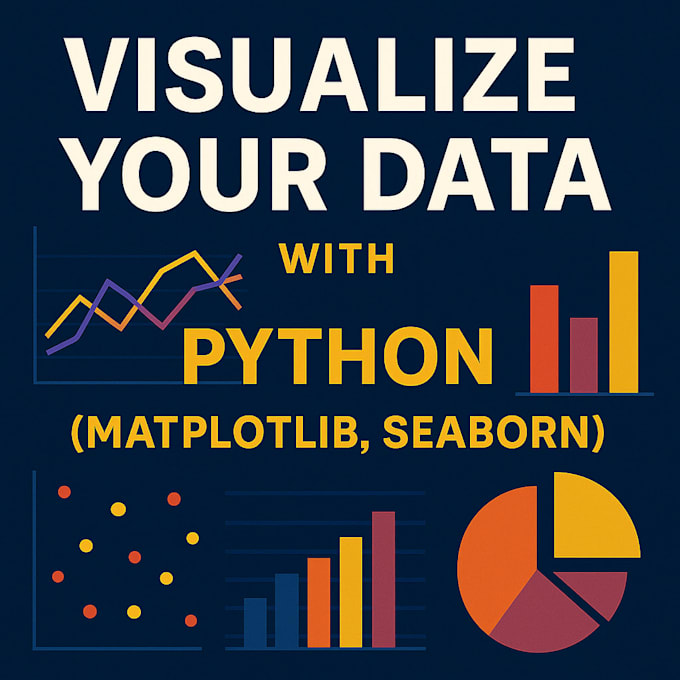
Want to transform your raw data into beautiful and meaningful charts? I will help you visualize your data using powerful Python libraries like matplotlib and seaborn.
Whether you're preparing a report, working on a project, or need visuals for presentations, I've got you covered!
What I Offer:
I work with business, academic, or research datasets. Just send me your dataset and tell me what insights you want to highlight.
Message me before placing an order for a custom offer or guidance.
Machine Learning and Research Data Expert, Python, Data Visualization
Languages
What format will you deliver the charts in?
I can send visuals in JPG, PNG, or PDF format, or deliver the full Python code in a Jupyter Notebook.
Can you help me understand the visuals?
Absolutely! I can provide short summaries or notebook comments explaining each chart.