I will do average income maps with web interactivity

R
raimundogeo
R
raimundogeo
Raimundo J.

About this gig

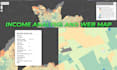
I will create an average income map with interactive web visualization to help you understand and present income distribution across a geographic area.


Using GIS tools and web mapping technologies, I transform income data into clear and professional maps that can be explored online.


This service is ideal for


  • socioeconomic analysis
  • real estate and market analysis
  • academic research
  • urban studies
  • public policy analysis
  • data journalism and reports


What I can deliver


  • Average income thematic map
  • Spatial data processing and visualization
  • Interactive web map for online exploration
  • Static map (PNG or PDF) if needed
  • Organized geospatial data


You can provide your own dataset (CSV, shapefile, GeoJSON, etc.), or we can discuss possible open data sources.


I focus on clear visualization, reliable data processing, and professional map design.


Please contact me before placing an order so we can discuss your project requirements.

Get to know Raimundo J.

Raimundo J.

Geographer

  • FromBrazil
  • Member sinceMar 2026
  • Avg. response time1 hour
  • Languages

    Portuguese, English, Spanish
GIS and geospatial analyst specializing in GIS mapping, geoprocessing, spatial analysis, and environmental mapping. I create professional maps, spatial datasets, and GIS analysis using QGIS and ArcGIS. Services include GIS mapping, digital cartography, remote sensing, satellite imagery analysis, land-use mapping, spatial statistics, and geospatial data processing. I help companies, researchers, and organizations turn geographic data into clear maps and spatial insights for environmental projects and decision-making. Reliable delivery and clear communication.

My Portfolio

Related tags