Browse categories
Explore
Fiverr Pro
English
$
USD

Level 2


I am a data visualization expert specializing in advanced and customized charts, graphs, and visuals. I create everything from simple static plots to interactive visuals and animated visual, ideal for presentations, reports, or web embedding.
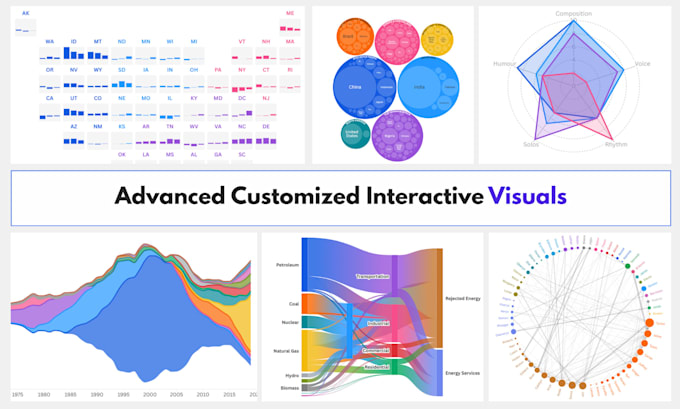
Line, Bar & Pie Charts: Line, area, bar, column, donut, pie, waterfall, fan chart, streamgraph, population pyramid, step chart, stacked/diverging bar, grid line/bar/area, line bump.
Scatter & Statistical: Scatter plot, bubble chart, beeswarm, dot plot, box plot, connected dot plot, violin, forest plot, Hans Rosling-style scatter (static/animated).
Hierarchy: Treemap, sunburst, packed circles, radial tree, dendrogram, hierarchical bars.
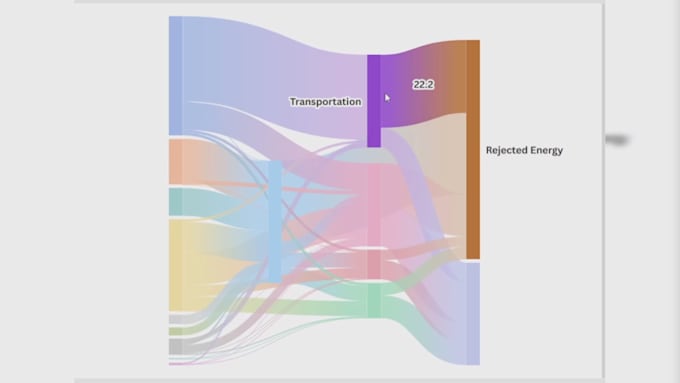
Flow Diagrams: Sankey, alluvial, fan diagrams.
Heatmaps: Categorical, numerical, cohort analysis, and climate-style heatmaps.
Other Visuals: Radar charts, bar/line chart race, slope, Gantt, pictograms, waffle charts, icon/rating visuals, chord diagram, calendar, gauge, network graph, table visuals, parliament chart, word cloud, and more.
All visuals can be static, interactive, or animated based on your needs. These are are embeddable and shared easily via a single link.
Message me before placing order.
Data Analysis, Data Visualization, Data Animation, GIS, Remote Sensing, Python
Level 2
Languages
| (1) | ||
| (0) | ||
| (0) | ||
| (0) | ||
| (0) |
mbangash99

United States
Excellent, professional, knew how to navigate the project without much instruction
$50-$100
Price
4 days
Duration

Seller's Response
| (1) | ||
| (0) | ||
| (0) | ||
| (0) | ||
| (0) |
mbangash99
United States
Excellent, professional, knew how to navigate the project without much instruction
$50-$100
Price
4 days
Duration
Seller's Response