Browse categories
Explore
Fiverr Pro
English
$
USD

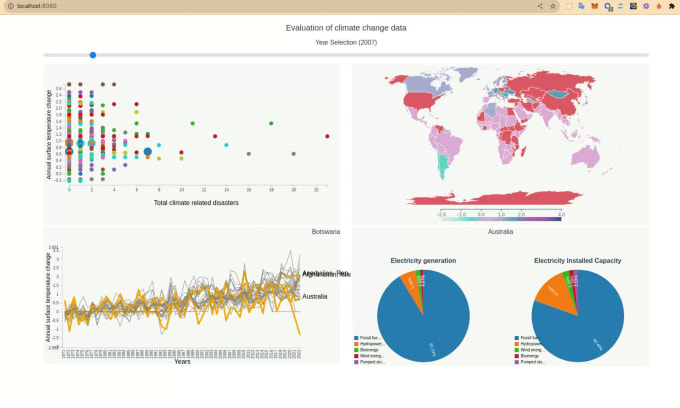
Welcome to the realm of data storytelling! I'm Rana, and I specialize in transforming raw data into visually stunning and interactive charts using the powerful D3.js library.
What I Offer:
Interactive Data Visualizations: Bring your data to life with captivating charts that tell a compelling story. Whether you need -
Or any custom visualization, I've got you covered.
Responsive Design: Ensuring a seamless user experience across devices, I develop responsive visualizations that adapt to different screen sizes without compromising on clarity or functionality.
Collaboration: I believe in transparent communication and collaboration. Your input is invaluable, and I'll work closely with you to achieve the perfect visualization.
Timely Delivery: Time is of the essence. I am committed to delivering high-quality visualizations within the agreed-upon time frame.
Let's transform your data into a visual masterpiece! Ready to embark on this data-driven journey together? Feel free to message me, and let's discuss how we can bring your ideas to life.
Languages