Browse categories
Explore
Fiverr Pro
English
$
USD

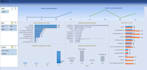

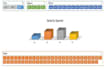
Well Come to my Gig related to Excel Graphs and charts dynamically
Being a user of Pro. level of Microsoft Excel i will help you in Microsoft Excel Graph, Charts or any data visualization, I have 7.0+ Year experience, I can help you in any kind of tasks as follows:
If you are interested, get in touch today to experiencing the outstanding work of excel Graphs, Charts and Data Visualization.
Thanks & Regards
Rao Kamran
Accounting, Bookkeeping, Excel and Power BI Consultant
Languages
Why i need to contact before placing an order?
I always like to discuss the requirement, analyze and determine the project size.Also i try to avoid any misunderstanding that leads to order cancellation, so it is best that we agree on the job before starting it.
If i have a query after the completion of job?
I always happy to respond any questions you have. Also, if you need any additions after the completion, we can discuss them


