How Much Does It Cost to Hire a Business Data Analyst?
Business data analyst costs in 2026 range from $80 to over $2,000 per project on freelance marketplaces, with hourly rates spanning $20 to $180 depending on specialization and project complexity.
 April 27, 2026
 9 minute reading
In 2026, businesses across every sector rely on data-driven decision-making to stay competitive, optimize operations, and predict market trends. From startups building their first customer segmentation models to enterprises managing complex BI systems, the demand for skilled business data analysts continues to surge as companies recognize that raw data holds little value without proper interpretation and strategic application.
Current marketplace pricing for business data analysis services reflects significant variation based on project scope, analytical methods required, and deliverable complexity. Based on Fiverr marketplace data, basic data analysis and reporting starts around $21, while specialized services like financial analytics and comprehensive BI analytics can reach $121 to $179 per project. Hourly rates show even wider spans, from $20 for straightforward data cleaning tasks to $180 for expert-level consultation. This guide breaks down what influences these costs, explains different pricing structures, and helps you understand which investment level matches your analytical needs.
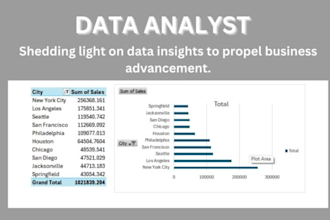
Average Business Data Analyst Costs
Based on recent Fiverr marketplace data, business data analyst services show considerable pricing diversity that corresponds directly to service type and complexity. Understanding these baseline costs helps businesses budget appropriately and set realistic expectations for project investments.
Data Analysis and Reports services start at approximately $31 for fixed-price projects, representing entry-level analytical work suitable for straightforward reporting needs. Statistical Modeling and Analytics commands fixed pricing around $98, with hourly rates ranging from $20 to $50, reflecting the specialized mathematical expertise these projects demand.
General Data Analytics services average $108.88 per project, while Data Analytics Consultation sits at roughly $100.56 fixed price with hourly rates between $40 and $60. This consultation category typically involves strategic guidance rather than hands-on analysis execution.
Specialized analytics categories command premium positioning. Financial Analytics averages $138 per project with consistent $80 hourly rates, reflecting the regulatory knowledge and precision these engagements require. Product Analytics reaches approximately $179 per project, while Marketing Analytics averages around $93, and BI Analytics settles near $121.97 with hourly rates spanning $40 to $200.
Data Cleaning services, foundational to most analytical projects, average $58.73 for standard work, though Data Dashboards within this category can start as low as $45 fixed or command hourly rates from $20 to $100 depending on dashboard complexity and interactivity requirements.
Data Visualization services present another pricing tier. Graphs and Charts average $75.44 fixed with hourly rates between $15 and $50. Data Dashboards in this visualization context average $142.66 per project. Consultation for visualization strategy runs approximately $106.68 fixed or $40 to $300 hourly. Reports average $99.47 with hourly spans of $25 to $125, while comprehensive Data Visualization projects can reach $189 on average.
Which Pricing Model Is Best for You?
Freelance business data analysts typically offer both fixed-price packages and hourly rate structures, each suited to different project characteristics. Fixed pricing works best when project scope is clearly defined from the outset, such as creating a specific dashboard, analyzing a contained dataset, or producing a predetermined report format. This model provides cost certainty and works well for businesses with limited budgets or those purchasing data analytics services for the first time.
Hourly pricing suits exploratory projects where scope may evolve as initial findings emerge, ongoing analytical support relationships, or complex engagements requiring iterative refinement. Projects involving multiple stakeholder reviews, changing business requirements, or experimental approaches to data problems typically benefit from hourly arrangements that accommodate flexibility without requiring constant contract renegotiation.
What Influences Business Data Analyst Pricing
Data Volume and Complexity
The size and structure of datasets directly impacts project cost. Analyzing a single CSV file with 5,000 clean rows might take 3 to 5 hours and cost $150 to $300 at mid-tier hourly rates. In contrast, working with multiple databases containing millions of records with inconsistent formatting, missing values, and integration challenges can require 40 to 60 hours of work, pushing project costs to $2,000 to $6,000 or more. Unstructured data from social media feeds, customer reviews, or sensor networks adds another complexity layer, often increasing project time by 30 to 50 percent compared to structured database work.
Analysis Methodology Required
Descriptive analytics that summarizes historical data through basic statistics and standard visualizations represents the most accessible price point, often completing within 5 to 10 hours for typical business datasets. Predictive analytics requiring regression modeling, forecasting algorithms, or machine learning approaches demands specialized statistical knowledge and typically doubles project timelines to 15 to 25 hours for comparable datasets. Prescriptive analytics that recommends specific actions through optimization algorithms or simulation models represents the highest complexity tier, potentially requiring 30 to 50 hours even for moderately sized projects, as these methods involve iterative testing and validation cycles.
Deliverable Sophistication
A basic PDF report with summary statistics and standard charts might add only 2 to 3 hours to pure analysis time, while interactive dashboards with drill-down capabilities, real-time data connections, and custom visualizations can require an additional 10 to 20 hours of development work. Presentation-ready deliverables with executive summaries, detailed methodology documentation, and stakeholder-specific versions add 5 to 8 hours to project timelines. Businesses requiring ongoing dashboard maintenance or regular report updates should expect monthly retainer costs ranging from $300 to $1,500 depending on update frequency and complexity.
Industry Specialization
Analysts with healthcare, financial services, or pharmaceutical industry expertise typically command 20 to 40 percent premium pricing compared to generalist analysts, as these sectors require regulatory knowledge, specialized metrics understanding, and domain-specific analytical frameworks. An analyst experienced in clinical trial data analysis or SEC financial reporting brings context that significantly reduces project risk and interpretation errors, justifying higher investment despite similar technical skill levels. Retail and e-commerce analytics generally sit at mid-market pricing, while emerging sectors like renewable energy or blockchain analytics may command premiums due to specialist scarcity.
Tool and Technology Requirements
Projects using widely adopted tools like Excel, Google Sheets, or basic SQL typically align with baseline market pricing. Requirements for specialized platforms like Tableau, Power BI, Python with advanced libraries, R for statistical computing, or proprietary analytical software increase costs by 15 to 30 percent, as these tools require specific training and licensing considerations. Real-time analytics requiring streaming data infrastructure or cloud-based processing environments add both complexity and cost, potentially increasing project investment by 25 to 50 percent compared to batch processing approaches.
Cost Breakdown by Project Scope
Understanding typical investment levels by project scale helps businesses align budget with expected deliverables and select appropriate service tiers for their analytical needs.
Basic Analysis Projects
- Typical investment range of $41 to $125 per project
- Includes descriptive statistics, standard visualizations, and straightforward reporting on clean datasets
- Covers single-dataset analysis with fewer than 10,000 rows, basic charts and graphs, summary reports in PDF or presentation format
- Best suited for small businesses needing occasional insights, startups validating initial assumptions, or teams supplementing internal capabilities for one-time projects
- Delivery typically completes within 3 to 5 business days
Intermediate Analysis Projects
- Typical investment range of $90 to $200 per project, or $40 to $100 per hour
- Encompasses multi-dataset integration, comparative analysis across time periods or segments, custom visualization development
- Includes correlation analysis, trend identification, segmentation studies, interactive dashboards with filtering capabilities
- Best suited for growing businesses establishing regular reporting cadences, companies comparing performance across divisions or markets, teams requiring dashboard solutions for ongoing monitoring
- Projects typically require 1 to 2 weeks for completion depending on revision cycles
Advanced Analysis Projects
- Typical investment range of $160 to $300+ per project, or $80 to $300 per hour
- Covers predictive modeling, machine learning implementation, prescriptive analytics, complex statistical testing
- Includes forecasting models, customer lifetime value analysis, churn prediction, optimization algorithms, A/B test design and analysis
- Best suited for established businesses making data-informed strategic decisions, companies developing business strategy and innovation initiatives, enterprises requiring sophisticated analytical capabilities
- Timeline extends from 2 to 4 weeks or longer for iterative model development and validation
Specialized Domain Projects
- Typical investment range of $120 to $200+ per project for fixed scope, or premium hourly rates
- Addresses industry-specific analytical needs requiring regulatory knowledge or specialized metrics
- Covers financial performance analysis with ratio calculations, healthcare outcomes analysis, marketing attribution modeling, supply chain optimization
- Best suited for businesses in regulated industries, companies requiring compliance-aware analysis, organizations needing business financial insights with industry benchmarking
- Projects require 1.5 to 3 weeks depending on data complexity and validation requirements
Related Services and Their Costs


Data Cleaning and Preparation
Before meaningful analysis can occur, datasets often require substantial cleaning to address missing values, inconsistent formatting, duplicate records, and structural issues. Data cleaning services typically cost $45 to $90 per project for straightforward datasets, though complex multi-source integration can reach higher investment levels. Many businesses underestimate this preliminary step, which can consume 40 to 60 percent of total project time for messy datasets. Engaging specialists for data preparation before analysis begins often reduces overall project costs and improves analytical accuracy.
Data Visualization and Dashboard Development
While many analytical projects include basic charts, sophisticated visualization development represents a distinct specialization. Custom dashboards with real-time data connections, interactive filtering, and mobile-responsive designs typically cost $100 to $180 per project or $20 to $100 hourly depending on platform complexity. Businesses requiring ongoing stakeholder access to analytical insights benefit from dashboard investments that enable self-service exploration without repeated analyst engagement. The initial development investment often proves more cost-effective than recurring report generation fees.
Statistical Consulting
Complex projects involving experimental design, hypothesis testing, or advanced statistical methodology benefit from specialized consultation before full analysis begins. Statistical consulting typically ranges from $40 to $300 per hour based on consultant credentials and problem complexity. This upfront investment of 2 to 5 consultation hours can prevent costly analytical missteps, ensure appropriate methodology selection, and improve stakeholder confidence in findings. Businesses tackling unfamiliar analytical challenges or high-stakes decisions particularly benefit from this guidance layer.
Business Intelligence Implementation
Organizations seeking permanent analytical infrastructure rather than project-based analysis often require BI system implementation. This encompasses data warehouse design, ETL pipeline development, and ongoing reporting framework establishment. BI analytics projects average around $122 per discrete deliverable but comprehensive implementations typically involve multiple phases spanning weeks or months with total investments reaching several thousand dollars. The long-term value lies in establishing repeatable analytical processes that reduce per-insight costs over time.
Report Generation and Automation
Businesses requiring regular reporting cadences benefit from automated report generation that produces consistent outputs as new data arrives. Report development services average $99 per project with hourly rates from $25 to $125. Initial automation setup requires higher investment but dramatically reduces recurring costs compared to manual report recreation. Organizations producing monthly performance reports, quarterly stakeholder updates, or weekly operational dashboards should evaluate automation investments that typically achieve cost recovery within 3 to 6 reporting cycles.
Ongoing Costs and Hidden Expenses
Beyond initial project fees, several recurring and supplementary costs affect total investment in business data analysis capabilities.
- Data storage and processing infrastructure costs ranging from $20 to $200 monthly depending on volume and cloud service selection
- Visualization platform subscriptions for tools like Tableau or Power BI averaging $15 to $70 per user monthly
- Report refresh and dashboard update services costing $100 to $500 monthly for regular maintenance
- Additional analysis iterations when initial findings prompt new questions, typically 20 to 40 percent of original project cost
- Data quality monitoring and cleansing for ongoing analytical accuracy, often $200 to $800 quarterly
- Training costs for internal teams to interpret and act on analytical insights, ranging from $300 to $1,500 per training session
- Expanded data source integration as analytical maturity grows, adding $150 to $600 per new source connection
Frequently Asked Questions
How much does business data analysis cost on Fiverr?
Business data analysis services on Fiverr span a wide pricing spectrum based on project complexity and deliverable type. Entry-level data analysis and basic reporting starts around $21 per project, suitable for straightforward descriptive statistics and simple visualizations. Mid-tier services including data cleaning, standard analytics, and basic dashboard creation range from $58 to $110 per project. Advanced offerings like consulting, financial analytics, predictive modeling, and comprehensive BI analytics typically cost $120 to $180 per project or more. Many sellers bundle related services, such as combining data cleaning with visualization or pairing analysis with presentation-ready reporting, which provides better value than purchasing services separately. Premium options reflect specialized industry knowledge, advanced statistical methods, or sophisticated interactive deliverables that justify higher investment.
What are typical hourly rates for business data analysts?
Hourly rates for business data analysts vary significantly based on expertise level and project requirements. Entry-level rates start around $15 to $30 per hour for basic data cleaning and simple chart creation. Mid-tier analysts with solid technical skills and several years of experience typically charge $40 to $80 per hour for general analytics, dashboard development, and standard reporting. Senior analysts and specialists command $100 to $180 per hour when projects require advanced statistical modeling, machine learning implementation, or deep industry expertise in sectors like finance or healthcare. Hourly pricing typically applies to exploratory projects where scope remains unclear, ongoing analytical support relationships, or complex engagements requiring iterative development with stakeholder feedback. Fixed-price packages generally prove more economical for well-defined projects with clear deliverables.
What is typically included in a basic business data analysis package?
Basic business data analysis packages typically include initial data review and quality assessment, descriptive statistical analysis covering means, medians, distributions, and key metrics relevant to business questions. Most packages provide 3 to 5 standard visualizations such as bar charts, line graphs, or pie charts that illustrate key findings, along with a summary report in PDF or presentation format explaining insights in accessible business language. Analysts usually accommodate one round of minor revisions to adjust chart formatting or clarify specific points. Packages generally assume working with a single clean dataset under 10,000 rows provided in standard formats like CSV or Excel. Additional costs apply for services like multiple dataset integration, custom dashboard creation, predictive modeling, or extensive data cleaning before analysis can begin.
Related Guides


About the author
Ayelet Ben-YishaiDirector of Data Analytics
Ayelet Ben-Yishai is a senior data analytics leader and current Director of Data Analytics at Fiverr, with a strong background in building and leading analytics teams across high-growth tech organizations. She has over 8 years of experience spanning hands-on data analysis, dashboard development, and strategic leadership, with deep expertise in SQL, BigQuery, Tableau, and business-driven analytics. Her career reflects a steady progression from analyst roles to head-of-analytics and group-level leadership positions.
