Browse categories
Explore
Fiverr Pro
English
$
USD
Data Analyst SPSS R SAS Quantitative and Qualitative Researcher
Greetings and welcome to my gig page!
Are you looking for quick, flawless statistical analysis and interpretation from an expert? Look no more because I got you covered in quantitative and qualitative analysis using SPSS STATA EXCEL MINITAB JASP JAMOVI among many others. With over 5 years experience in statistical methods, I will analyze your survey or secondary data to draw useful insights. My services are not limited to the following;
Statistics
DESCRIPTIVE STATISTICS
Measures of Central tendency
Measures of Dispersion
Probability Distributions
Statistical level of measurements
Sampling Methods
Probability and probability distributions
INFERENTIAL STATISTICS
Normal distribution
Confidence intervals
Tests for proportions
Z-tests
T-tests
ANOVA
Chi-Square
Experimental analysis.
Non-Parametric tests
Statistical tools: SPSS EXCEL GRETL STATA MINITAB JASP JMP SAS
Feel free to contact me in case of any difficulty.
Kindly contact before placing an order.
Kind Regards.
1. Can you help with data analysis if I’m using secondary data for my research?
Absolutely! I can assist with analyzing secondary data for your research. Whether you have survey data, public datasets, or other forms of secondary data, I will guide you through the statistical methods to properly analyze the data and draw meaningful insights.
2. What types of statistical analysis do you offer for research proposals?
I provide a wide range of statistical analysis services for your research. This includes both descriptive and inferential statistics. I can assist with measures of central tendency, dispersion, and probability distributions, as well as hypothesis testing .
3. Do you provide guidance on how to interpret and present statistical results in my research?
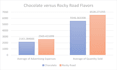
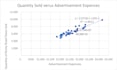
Yes, I provide comprehensive guidance on how to interpret and present the results of your statistical analysis. This includes creating clear tables, graphs, and written explanations that align with academic standards and your research goals.


