Browse categories
Explore
Fiverr Pro
English
$
USD


Have sales figures in Google Sheets but struggle to see the bigger picture?
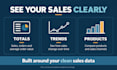
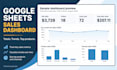
I will turn one organized sales table into a clear Google Sheets dashboard showing your totals, trends, and top products or services.
Depending on your package, your dashboard can include:
- Sales totals, order counts, units sold, and average order value
- Monthly sales trends and product or category charts
- Date and category filters
- A previous-period comparison
You receive an editable Google Sheets workbook, checked calculations, and a short guide explaining how to add new rows and use your dashboard.
All packages cover one clean source table with up to 5,000 rows and 15 columns, in one currency. Your data must include the fields needed for your chosen metrics.
This service excludes data cleanup, combining files, Apps Script, external connections, forecasting, and repairs to existing dashboards.
Please message me with an anonymized sample and the numbers you want to track so we can confirm the fit before you order.
AI Solutions Architect
Languages
What data do I need to provide?
Provide one table with a header row, consistent columns, real dates, and numeric sales amounts. Explain whether each row is an order or an order line. Order-level measures require an order ID; product charts require a product field. Share an anonymized sample before ordering.
What does clean data mean?
Your table should have consistent dates and categories, no merged cells or embedded subtotal rows, and no duplicate records that need investigation. Missing or inconsistent records and combining separate files require separate scope.
Will the dashboard update when I add sales?
Yes. It will recalculate when you append rows to the supplied source tab using the same columns and formats, within the 5,000-row limit. I include instructions. Fetching data from other systems and scheduled imports are excluded.
Can you connect Shopify, a CRM, or accounting software?
External connections are not included. You can supply a clean export matching the agreed table layout. This Gig does not log into those services or build integrations.
Which sales numbers can you show?
Examples include sales amount, distinct orders, units sold, and average order value. We agree on definitions and available fields before work starts, including how refunds, tax, and shipping should be treated. All amounts must use one currency.
What is included in a revision?
One consolidated round of changes to agreed labels, colors, charts, or layout. New metrics beyond package limits, new sources, changed business rules, or extra dashboards require separate scope. Corrections to my work are included in delivering the agreed requirements.
Does this work in Excel or Looker Studio?
This service delivers a Google Sheets workbook for use in a desktop browser. Excel conversion, Looker Studio dashboards, and a separate mobile layout are not included.
What does the Premium comparison include?
One agreed previous-period comparison for up to four of your included metrics, such as this month versus last month. Your source needs data for both periods. It does not include forecasting or multiple comparison methods.


