Browse categories
Explore
Fiverr Pro
English
$
USD
Full Stack Developer and Data Analyst
Need to make sense of your data? I'll turn your raw numbers into clear, actionable insights!
I specialize in data analysis and visualization using Python, SQL, Power BI and Tableau.
WHAT YOU GET:
- Full exploratory data analysis (EDA)
- Data cleaning and transformation
- Interactive visualizations and dashboards
- Machine Learning models if needed
- Clear report explaining findings and recommendations
- Python code (Jupyter Notebook) or Power BI file delivered
TOOLS I USE:
- Python: pandas, NumPy, matplotlib, seaborn, scikit-learn
- Visualization: Power BI, Tableau, Plotly, Dash
- Databases: SQL, MySQL, PostgreSQL, MongoDB
EXAMPLES OF WHAT I'VE BUILT:
Customer Churn Prediction 83% accuracy ML model
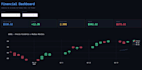
Real-Time Financial Dashboard Live stock data with Python + Plotly
Sales Analysis ETL pipeline + interactive dashboard
Just send me your dataset and I'll tell you exactly what I can do for you!
Message me before ordering so we can discuss your project!