Browse categories
Explore
Fiverr Pro
English
$
USD

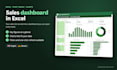
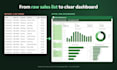

Send me your sales data in Excel and I'll turn it into a dashboard you can open every week: the key numbers at the top, charts that show what sells and what doesn't, and filters to click through months, products or sales channels.
I run a small online shop myself, so I know what kind of questions you want answered. For example: Which products sell best? How do sales change per month? Which channel brings the most?
It works with sales, orders, stock and most other lists.
What you get:
- an Excel file with your data, a dashboard sheet and a short "Read me" sheet
- charts and key figures that fit your data
- filters you can click (slicers), from the Standard package on
- clean formatting, for example months in the right order and numbers with thousands separators
With the Premium package you can update the dashboard later: add new rows, press refresh, done.
Please message me before you order. Tell me what your file looks like and what you want to see, and I'll tell you which package fits.
Please don't send names, e-mail addresses or other private customer data. Remove them or replace them with an ID first. A dashboard doesn't need them.
Excel and Google Sheets dashboards, data cleanup and automation
Languages
Can the dashboard be in German?
Yes. I speak German (native) and English, so the dashboard, the labels and our messages can be in either language. Just tell me which one you want.
Which Excel version do I need?
Any Excel from 2016 on works for the basic dashboards. If you use an older version, tell me before you order. For the Premium package (refresh with one click) you need Excel for Windows or Microsoft 365. On a Mac the refresh part is limited, so please ask me first.
Do you use AI?
Yes, I use AI tools for part of the work. I check every file myself before I send it to you, and I click through the filters and charts to make sure they work.
What happens to my data?
It is only used for your order. I don't pass it on, and I delete it from my computer after 90 days. If you want it gone earlier, just say so.
My file has customer names or e-mails. Is that a problem?
Please remove them or replace them with an ID before you send the file. A dashboard doesn't need them, and that way your customers' data stays with you.
What do I need to send you?
Your file (Excel or CSV, a Google Sheets export works too) and two or three things you want to see. If you are not sure yet, send the file and I'll make a suggestion.
Can I get changes after the delivery?
Corrections are included as listed in the package. Bigger changes or new wishes are possible as a new offer, I'll tell you the price first.
Do you make dashboards for Google Sheets or Power BI?
This gig is for Excel. If you need something else, send me a message first.
How fast do you reply?
Usually within a few hours, at the latest within 24 hours.


