Browse categories
Explore
Fiverr Pro
English
$
USD
Infrastructure, Automation and Monitoring Consultant
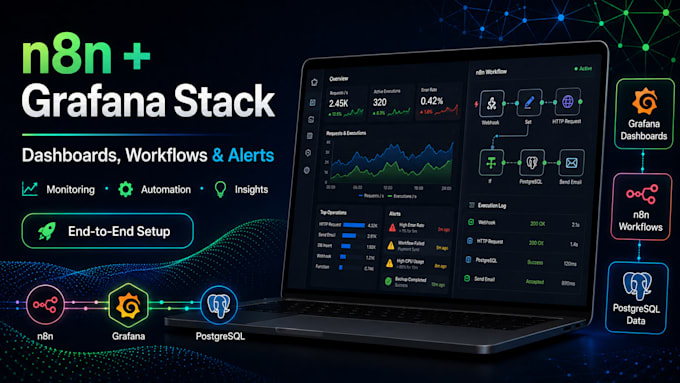
I will build Grafana dashboards using PostgreSQL metrics so you can monitor services, APIs, processes or operational data from a clear private dashboard.
This Gig is focused on observability, reporting and technical monitoring. I can help you review your available data, define useful KPIs, connect PostgreSQL as a Grafana data source, create panels, write basic SQL queries and configure alerts when included in the selected package.
Typical use cases include service health dashboards, API monitoring, historical metrics, process tracking, uptime/status panels, error counters, response times and operational KPIs.
I can work with an existing PostgreSQL database or with data collected from automation workflows, scripts or APIs. The goal is to turn raw data into useful, readable and actionable dashboards.
Depending on the package, I can include dashboard design, PostgreSQL data source configuration, SQL queries, alert rules, review and technical documentation.
I do not provide financial advice, trading execution or custody services. Any DeFi/on-chain use case is limited strictly to technical monitoring and reporting.




Tools:
Docker
•
GitHub
Frameworks:
Other
Cloud Provider:
Other
Programming language:
Bash
•
Python
Expertise:
Installation
•
Development
•
Configuration
Do I need to already have a PostgreSQL database?
Not necessarily. I can work with an existing PostgreSQL database or help define the expected data structure if your metrics will be collected later from scripts, APIs or automation workflows. Full data ingestion is not included unless agreed separately.
Can you create Grafana dashboards from API data?
Yes, if the API data is already stored in PostgreSQL or the collection flow is clearly defined. I can build panels, queries and alerts from available metrics. If API extraction is also needed, contact me before ordering.
What kind of dashboards can you build?
I can build technical and operational dashboards for service health, API monitoring, uptime/status, error rates, response times, historical metrics, process tracking, business KPIs and reporting. The exact panels depend on the available data and the selected package.
Are alerts included?
Alerts are included only when specified in the selected package or agreed in a custom order. I can configure basic Grafana alert rules for thresholds, service status, error rates or other measurable conditions, depending on the available data and notification channel.
Do you work with DeFi or on-chain monitoring?
Yes, but only from a technical monitoring and reporting perspective. I can help visualize metrics, historical values and alerts in Grafana. I do not custody funds, request seed phrases, sign transactions, execute trades/rebalancing or provide financial advice.
Can you help me choose and set up the VPS?
Yes. I can help you choose a suitable VPS provider, define the required size and configure the server. VPS, domain and third-party provider costs are not included and must be paid directly by the client.