Browse categories
English
$
USD
Connect to your AI

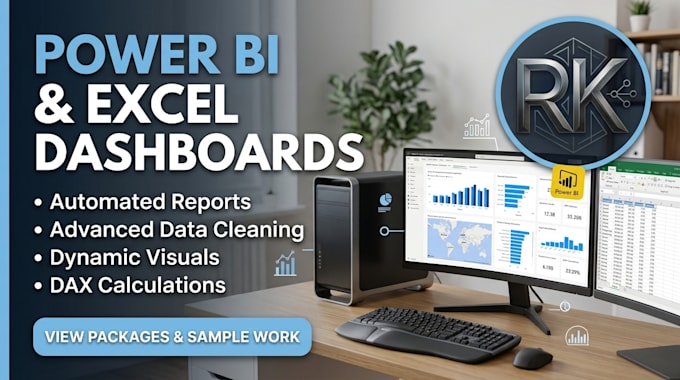

Struggling to turn static Excel spreadsheets into clear, interactive business insights?
I will connect, clean, and transform your raw Excel or CSV files into a dynamic, executive-ready Power BI dashboard that updates automatically whenever you refresh your data.
What I Can Build For You:
Virtual Assistant
Languages
How do I update the Power BI dashboard when I get new Excel data?
I build an automated Power Query pipeline linked directly to your Excel file or folder. Whenever you add new rows or drop a new monthly Excel file into the folder, simply open Power BI and click Refresh—all visuals and DAX calculations will update automatically.
Will I receive the editable Power BI file?
Yes, every package includes the full .pbix source file so you own the dashboard and can modify or publish it to Power BI Service anytime.
What if my Excel data is messy or spread across multiple tabs?
No problem. Using Power Query, I can clean, unpivot, and merge multiple Excel sheets or CSV files into one unified data model.
