Browse categories
Explore
Fiverr Pro
English
$
USD
Australia
Carbon Accounting and GHG Emissions in R, Scopes 1 to 3, TCFD, IFRS S2
Hi, I'm Ruihan (Leila). I'm a researcher and quantitative analyst with a Master's in Accounting (UWA) and a BSc in Statistics from the University of Auckland. I'll run statistical analysis and produce publication-ready visuals in R for your research, thesis, or business question.
What you get: a reproducible R script (commented, parameterised, re-runnable with new data); clean ggplot2 visuals; a written results summary explaining what the numbers mean (Standard and Premium); methodology notes so your reader or marker can follow the logic.
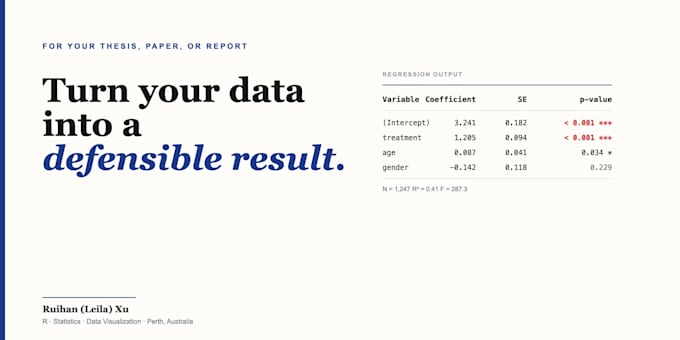
Methods I can run: descriptive stats, t-tests, ANOVA, chi-square; linear and multiple regression, logistic regression; mixed-effects models, time series (ARIMA), multivariate analysis at the Premium tier. Data cleaning and missing-data handling are in every package.
Background: R code for a Yale econometrics research project (paper published); audit and finance internship experience; bilingual in Mandarin and English.
Before you order: send me a short description of your dataset (rows, columns, what each variable means) and the research question. I'll confirm the right package and timeline before any work begins.


What data formats do you accept?
Excel, CSV, TSV, SPSS .sav, Stata .dta, R .rds. PDF tables are OK but need extra cleaning time. Send a small sample first so I can confirm the format works.
Can I get a written explanation of results, not just code?
Yes. Standard includes a 1-2 page written results summary in plain English. Premium includes a full report with methodology and interpretation, suitable for thesis or paper.
Do you handle missing data and outliers?
Yes. Data cleaning and validation are included in every package. I document the approach (deletion, imputation, transformation) in the methodology notes so reviewers can audit it.
Can the output go straight into my thesis or paper?
Yes. ggplot2 visualizations are publication-ready (300 DPI, vector PDF or SVG on request). The methodology doc is suitable as an appendix or supplement.
Do I get the R code?
Yes. Every package includes the full R script (well-commented and parameterised), so you can re-run with updated data next year. Reproducibility is the whole point.
What if my dataset is bigger than the package limit?
Message me first and Ill send a custom offer. Premium covers up to 20000 rows; beyond that we need to scope based on complexity and methods.