Browse categories
Explore
Fiverr Pro
English
$
USD


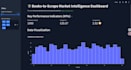
Tired of static Excel reports? Let's turn your raw data (CSV, Excel, Google Sheets) into a stunning, interactive web dashboard.
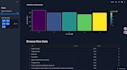
I don't just make charts; I build custom web applications using Python, Streamlit, and Plotly. This allows you and your team to filter, explore, and find insights in real-time.
What My Dashboard Service Includes:
Why Choose Me for Your Dashboard?
Please message me BEFORE ordering!
Dashboard projects are highly custom. A 5-minute chat is the best way to confirm the scope, price, and ensure your project's success.
Python Expert for Data Analysis, Visualization and Automation
Languages
Why must I contact you before ordering?
Dashboard projects are highly custom, not 'off-the-shelf' products. A 5-minute chat is the only way to ensure we agree on all features, the data sources, and the final design. This prevents misunderstandings and guarantees you get the exact app you are envisioning.
How will I receive the final dashboard? Do I need my own server?
You do not need any servers! I will deploy the final dashboard to a free, secure, and private (or public) web link using Streamlit Cloud. You will receive a URL that you can access from any browser, just like my portfolio demo. It's a fully hosted solution.
What does a 'revision' include for a dashboard?
A revision covers adjustments to the *agreed-upon* features (e.g., changing chart colors, tweaking the layout, or fixing text). It does **not** include adding new pages, new data sources, or new interactive features that were not discussed in our original order. These require a Gig Extra.
What kind of data file do I need to provide?
My Basic and Standard packages assume you have a single, 'clean' data file (e.g., CSV, Excel). If your data is messy, in multiple files, or needs to be scraped, please select the Premium package or message me first. I also offer data cleaning as a separate service!
Why is this Streamlit dashboard better than just getting Excel charts?
An Excel chart is a static image. A Streamlit dashboard is a **live, interactive tool**. Your entire team can access a web link, filter the data 24/7, and explore insights in real-time without needing any special software. It brings your data to life.


