Looks Like This Service Is On Hold

I will do python data visualization

T
the_preactuary
T
the_preactuary
the_preactuary

About this gig

If you need to visualize your data in a easy and clear way, this is the gig you're looking for.


I'll create a Python code to visualize the data in the following ways:


  • Bar chart
  • Histogram
  • Scatter plot
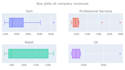
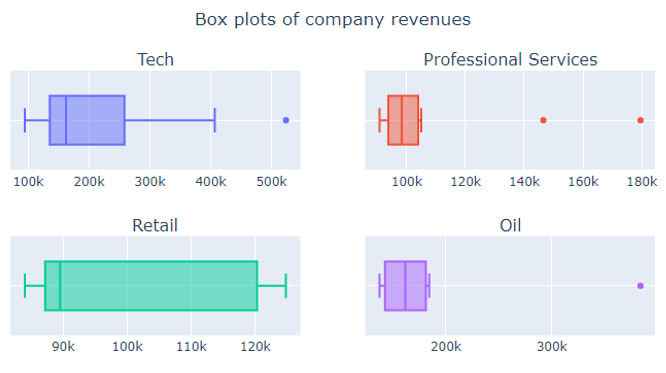
  • Box plot
  • Line chart
  • Pie chart
  • Subplots


Tell me what you need and I'll code it. Just give me your clean data in csv format.


Please ask before order.

Get to know the_preactuary

the_preactuary
  • FromMexico
  • Member sinceMay 2021
  • Languages

    English, Spanish
Hey, my name is Jair, I'm an Actuarial Science student, almost done. I'm passionate for maths. I already past the first SOA (Society of Actuaries) exam, Exam P, it is about Probability. I'm expecting not only solving your problems, but make you understand how and why is that the solution.