Browse categories
Explore
Fiverr Pro
English
$
USD
Gig Summary
Web Developer, Python Developer, MERN Stack, UML Expert, Data Analyst
Level 1
Has met certain performance criteria and shows strong potential in the marketplace.
I offer professional data analysis, data visualization, and machine learning services using Python. Whether you're looking for detailed data analysis or need to display your findings with clear graphs, Ive got you covered. I use Python libraries like Pandas and NumPy to conduct thorough analyses tailored to your needs. From tracking trends and identifying correlations to calculating key metrics, my approach ensures you get the most out of your data.
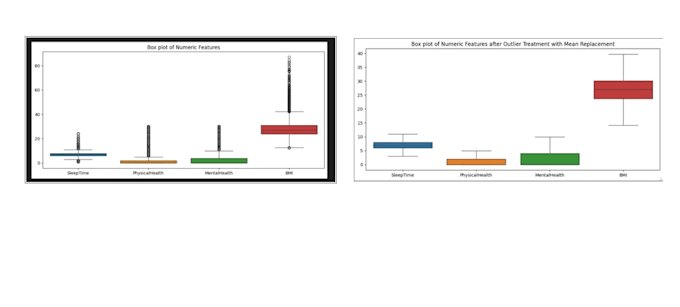
For data visualization, I create visually engaging graphs and charts using tools like Matplotlib, Seaborn, and Plotly. I specialize in bar charts, scatter plots, histograms, and interactive dashboards, providing a real-time view of your data. My goal is to make complex insights accessible through effective data visualization.
Additionally, I can implement machine learning models to help you predict trends, classify data, and derive actionable insights. Whether its data analysis, visualization, or integrating machine learning, I transform your data into meaningful results, always utilizing the full power of Python.
Lets collaborate to transform your data with expert analysis, captivating visualization, and innovative machine learning.
What data formats do you accept for analysis and visualization?
I can work with various data formats, including CSV, Excel, JSON, and databases such as MySQL and SQLite. If your data is in a different format, feel free to share the details, and I'll assist in converting it to a workable format.
How will you ensure the accuracy and quality of the data analysis?
I follow a structured approach to data analysis that includes data cleaning, exploratory data analysis (EDA), and the use of appropriate statistical and machine learning models. I also validate results with cross-checks and provide transparent reports on my findings.
What types of visualizations can you create?
I can create a wide range of visualizations, including bar charts, line graphs, scatter plots, pie charts, histograms, heat maps, and interactive dashboards using tools like Matplotlib, Seaborn, Plotly, and Tableau. Let me know your specific preferences!
| (6) | ||
| (0) | ||
| (0) | ||
| (0) | ||
| (0) |
pierrotjanson

Belgium
Very fast work
Up to $50
Price
2 days
Duration
pierrotjanson
Belgium
Good as always
Up to $50
Price
1 day
Duration
pierrotjanson
Belgium
Good as always
Up to $50
Price
1 day
Duration
pierrotjanson
Belgium
very good work
Up to $50
Price
1 day
Duration
pierrotjanson
Belgium
Very fast work
Up to $50
Price
4 days
Duration
| (6) | ||
| (0) | ||
| (0) | ||
| (0) | ||
| (0) |
pierrotjanson
Belgium
Very fast work
Up to $50
Price
2 days
Duration
pierrotjanson
Belgium
Good as always
Up to $50
Price
1 day
Duration
pierrotjanson
Belgium
Good as always
Up to $50
Price
1 day
Duration
pierrotjanson
Belgium
very good work
Up to $50
Price
1 day
Duration
pierrotjanson
Belgium
Very fast work
Up to $50
Price
4 days
Duration