Browse categories
Explore
Fiverr Pro
English
$
USD


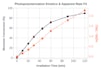
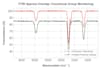

Welcome to my Scientific Data Visualization and Figure Design service.
I specialize in converting raw experimental and computational datasets into clean, 300+ DPI publication-ready figures aligned with leading journal guidelines (ACS, Elsevier, Springer, Wiley).
What I offer:
Custom Scientific Plotting: Photopolymerization kinetics, pseudo-first-order rate fitting ln([M]0/[M]t), spectral overlays (FTIR, UV-Vis), and calibration curves.
Multi-Panel Layouts: Combining sub-figures (A, B, C) with uniform typography, balanced axes, and clear legends.
Modern Tech Stack: Built using Python (Matplotlib, Seaborn, Pandas) and OriginLab.
High-Resolution Vector Exports: 300+ DPI TIFF, PNG, PDF, or EPS ready for print and online publication.
Strict Data Integrity: Accurate error bar propagation (SD, SE) directly from your raw data.
Deliverables:
1. High-resolution figure files (TIFF, PNG, PDF).
2. Clean layout adhering to journal width specifications (single-column or double-column).
3. Optional Python plotting source code for your records.
Policy Notice:
This service is strictly technical data visualization, graphical formatting, and code-based figure preparation.
Editing your scientific manuscript or research paper and Data Visualization
Languages


