My work is to research and provide comprehensive EDA services using Python and R to extract meaningful insights from your datasets to analyze data, solve problems, and make your life easier with interactive visualization (graphs & charts).
My Services Include:
- Data Exploration: Delve into your datas features and dimensions to gain a thorough understanding.
- Data Pre-Processing: Clean and prepare your data by handling missing values, outliers, and performing necessary type conversions.
- Univariate Analysis: Create a range of charts and graphshistograms, box plots, and moreto analyze individual variables.
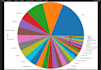
- Bivariate Analysis: Use scatter plots, bar charts, and line charts to investigate relationships between two variables.
- Multivariate Analysis: Generate correlation matrices and heatmaps to explore interactions among multiple variables.
Tools & Technologies:
- Python: Numpy, Pandas, Seaborn, Matplotlib, Plotly
- R: R-Studio
- Additional Tools: Excel, Tableau, PowerBI
What You Will Receive:
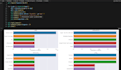
- Python Notebook: A detailed notebook with clear comments explaining each step.
- Source File: Full access to the source files for