Browse categories
Explore
Fiverr Pro
English
$
USD
India
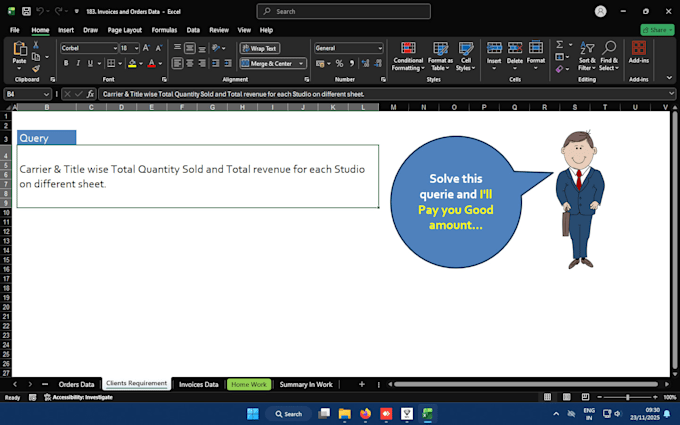
I am an expert Excel specialist ready to solve your most complex data challenges. I specialize in transforming raw data (like your Orders/Invoices data) into powerful PivotTable summaries, automated reports, and professional models that drive business decisions.
What I Offer:
I will use advanced Excel features to meet specific queries like "Carrier & Title wise Total Quantity Sold and Total revenue for each Studio." My services include:


Platform:
Excel
•
Google Sheets
Development technology:
VBA
Expertise:
Pivot tables
•
Cleaning
What kind of data do you need from me to start?
I need your raw data in a standard format (usually Excel, CSV, or Google Sheets). Please also provide a clear description of the specific output or reports you require (e.g., "Total Quantity Sold by Customer and Item Type," as seen in your queries).
Can you work with very large datasets?
Yes, I am experienced in handling large datasets. For files exceeding a certain size (e.g., 50,000 rows), I use advanced tools like Power Query and Power Pivot to ensure performance and efficiency. Please specify the size of your file when you contact me.
I'm not sure which package I need. How do I decide?
BASIC is best for simple clean-up, formatting, and applying a few basic formulas (like SUM or VLOOKUP). STANDARD is ideal for creating professional reports and dynamic PivotTables from medium-sized data. PREMIUM is for complete model creation, complex automations using VBA/Macros, or integrating m
Do you use VBA/Macros for automation?
Yes. I use VBA/Macros and Power Query to build robust automation solutions, especially in the PREMIUM package, allowing you to refresh complex reports with a single click.
Will the formulas and reports be dynamic and editable?
Absolutely. I ensure all formulas are correct and the reports (especially PivotTables) are dynamic, meaning you can easily filter, change parameters, and update the data yourself. I always include the source code in all packages.