Browse categories
Explore
Fiverr Pro
English
$
USD

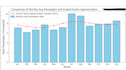
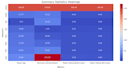
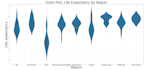
Do you have raw data that needs to be transformed into meaningful insights?
Im here to help you turn your numbers into clean, informative, and professional charts and graphs using Python in Jupyter Notebook.
With experience in Matplotlib, Seaborn, and Pandas, Ill deliver visuals that make your data easy to understand and ready to present.
What I Offer:
Tools I Use:
Whether you need visuals for a report, project, or presentation Ill make your data speak clearly.
Lets get started place your order or message me with any questions!!!!
Languages
What do I need to provide to get started?
Just share your dataset (CSV, Excel, or JSON format preferred) along with a brief explanation of what you want visualized. If you have preferences for chart types or styles, feel free to mention them!
What tools do you use for data visualization?
I use Python in Jupyter Notebook, primarily with Matplotlib, Seaborn, and Pandas for clean, informative, and customizable visualizations.
Can you help with insights or analysis too?
Yes! In the Standard and Premium packages, I provide a summary of insights or key takeaways based on your data and visualizations.
Will I get the source code and plots?
Absolutely. You'll receive the Jupyter Notebook (.ipynb) with all code, and image files (PNG/JPG) of the charts as needed.
Can you handle large or complex datasets?
Yes, but for large datasets or complex requirements, please message me first so we can discuss the best approach and pricing.


