Browse categories
Explore
Fiverr Pro
English
$
USD




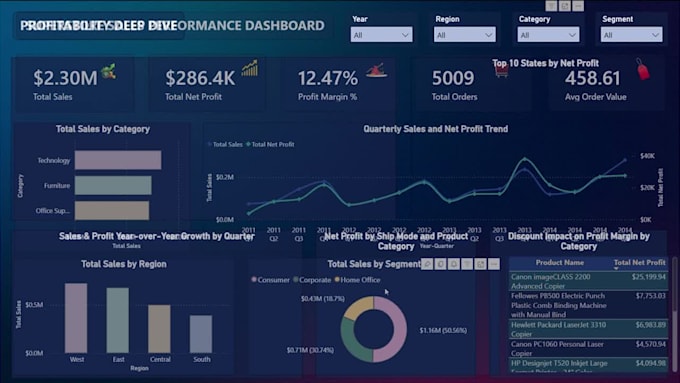
Need a clean, modern, and interactive Power BI sales dashboard that turns raw data into clear KPIs, visuals, and business insights?
I will create a professional Power BI dashboard using Excel/CSV data, Power Query, data modeling, and DAX measures. The dashboard can include sales, profit, orders, regions, categories, products, customers, trends, and performance analysis.
What you will get:
Perfect for retail, e-commerce, sales teams, managers, and small businesses that want data-driven decisions.
Portfolio project:
https://github.com/Sumon2122-stack/superstore-sales-performance-dashboard
Please send your Excel or CSV data before ordering so I can review your requirements and suggest the best package.
Data Analyst Expert in Power BI, Tableau, Looker, SQL, Python, R and Excel
Languages
Will you only create visuals, or also provide business insights?
I focus on both. I create clean Power BI visuals and also highlight key trends, performance gaps, and actionable insights so the dashboard supports real business decision-making.
Can you clean and transform my raw data before building the dashboard?
Yes. I can clean, format, transform, and prepare your Excel or CSV data using Power Query and Power BI before creating the dashboard and KPIs.
Can you create advanced KPIs and DAX measures?
Yes. I can create DAX measures for sales, profit, margin, orders, average order value, growth rate, ranking, category performance, regional performance, and other custom metrics.
Will the dashboard be interactive and easy to use?
Yes. I can add slicers, filters, drill-downs, buttons, and interactive visuals so users can explore performance by date, region, category, product, customer segment, or other fields.
How do you handle data confidentiality?
Your data will be used only for your project and handled with confidentiality. I do not share your files or business information with anyone. I can also sign an NDA if required.
What counts as a revision?
Revisions include layout adjustments, formatting changes, minor chart updates, KPI corrections, and small changes based on the original scope. New datasets, extra pages, or major changes may require a custom offer.
Why should I contact you before placing an order?
Every dataset is different. Please message me first so I can review your data structure, understand your KPIs, confirm the scope, and recommend the best package for your dashboard.