Browse categories
Explore
Fiverr Pro
English
$
USD
3D Digital Twins | MLOps Dashboards | Interactive Scientific Tools
Built by a physicist who writes GPU shaders AND database queries.
Need more than bar charts? I build custom interactive visualization platforms for scientific, engineering, and data-intensive applications.
WHAT I BUILD:
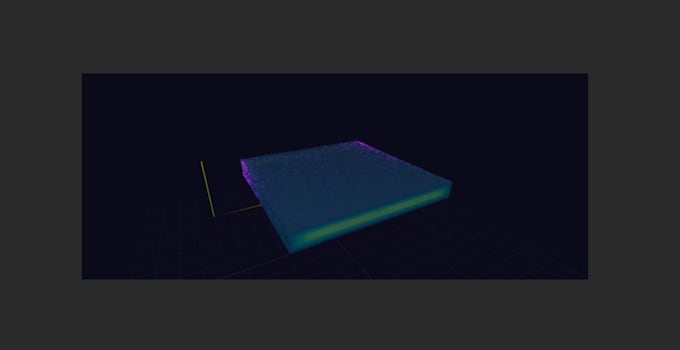
3D Interactive Visualizations (Three.js + WebGL): 3D model viewers, GPU particle systems, custom GLSL shaders, digital twins
Data Dashboards (Plotly Dash / Python): Multi-page reactive apps, real-time monitoring, interactive scientific plots
Interactive Charts (D3.js): Custom SVG charts, dual-axis plots, responsive web figures
Full-Stack Web Apps: Vue 3 frontends, dark-mode UIs, async task processing, Docker deployment
MY WORK:
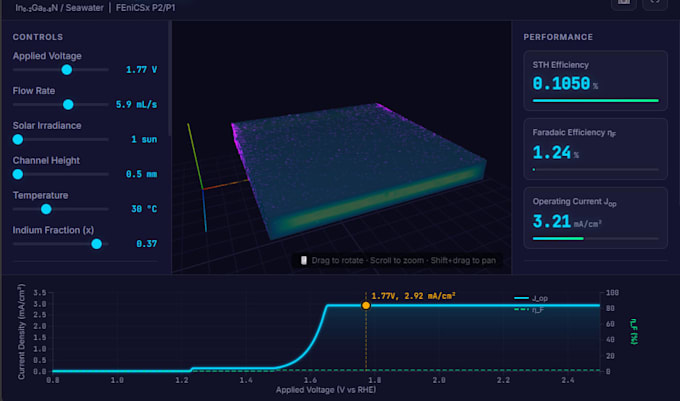
PEC Reactor Digital Twin 3D web app with 8,000 GPU particles, real-time sliders, performance gauges
ML Ops Platform 22-page enterprise dashboard, 26 DB tables, 24 async task types
Physics Society Website 16-page Vue 3 SPA with dynamic routing
WHY ME?
Most devs don't understand your scientific data. Most scientists can't build web apps. I do BOTH: GLSL shaders + PostgreSQL schemas, Three.js + Celery queues.
Message me with what you want to visualize. I'll sketch a layout.

What technologies do you use for dashboards?
It depends on your project. Plotly Dash for data-heavy dashboards with interactive plots and database backends. Three.js + D3.js for 3D visualizations, WebGL scenes, and custom interactive charts. Vue 3 for content-driven websites and SPAs. I'll recommend the right tool after understanding your data
Can you connect the dashboard to my database or API?
Yes. I've built dashboards backed by PostgreSQL (26-table schemas), SQLite, HDF5 files, REST APIs, CSV/JSON files, and simulation outputs. For live data (sensor feeds, IoT), I can set up polling or WebSocket connections for real-time updates.
Will it work on mobile and different screen sizes?
Plotly Dash and Vue 3 dashboards are responsive by default. For Three.js 3D visualizations, I optimize for desktop (≥1366px) since 3D works best with a mouse, but the layout adapts to smaller screens with rearranged panels.
Can I update the data myself after delivery?
Absolutely. Database-backed dashboards auto-refresh when data changes. File-based dashboards work by replacing CSV/JSON files. Every delivery includes a README explaining how to update data, add pages, and deploy changes.
Do I need a powerful computer for 3D visualizations?
No. My 3D visualizations run in any modern browser, no plugins or downloads needed. They use WebGL (GPU-accelerated) and work on standard laptops and tablets. I optimize for integrated GPUs so even low-end hardware runs at 60fps.
What's the difference between your packages?
Basic is a single-page static dashboard with charts. Standard is a multi-page interactive app with database backend and 3D/advanced charts. Premium is a full platform with auth, async tasks, API, and comprehensive deployment. Message me and I'll recommend the right fit.
What makes you different from other dashboard freelancers?
Most dashboard devs are frontend specialists who don't understand scientific data. I'm a physicist who also writes full-stack code, GLSL shaders, and designs databases. I understand your data AND your user experience — delivering production code, not prototypes.
Should I message you before ordering?
Yes please! Message me with what you want to visualize. I'll sketch a layout, recommend the right technology, and give you a fixed-price quote.