Browse categories
Explore
Fiverr Pro
English
$
USD

As a Data Scientist, I believe in Data-driven decisions and analyze data for useful information.
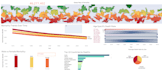
I will make : Line chart - Area chart - Bar chart - Pie chart - Histograms - Scatter plots - Bubble chart - Heat maps - Trees - maps - Dual Axis chart and all other type of charts
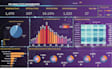
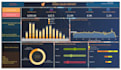
Make eye-catching tableau dashboards and storytelling boards.
Cleaning, joining, and blending of data
Fields that have been calculated.
Table Calculations
Expressions with a high level of detail
Use parameters, sets, groups, filters, and interactive filters.
I will create attractive charts using your data. Insightful interactive dashboards and storyboards.Please feel free to contact us.
Please consult before placing your order.
Languages


