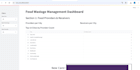
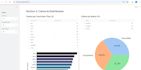
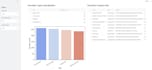
Transform Your Data into Powerful Interactive Dashboards
Looking for a professional Streamlit dashboard tailored to your needs? You've come to the right place!
I specialize in building custom Streamlit applications using Python to help businesses, researchers, and individuals visualize and analyze their data through clean, interactive, and responsive dashboards.
What I Offer
- Custom Streamlit dashboards
- Interactive data visualizations with Plotly & Matplotlib
- Business analytics and KPI dashboards
- CSV, Excel, SQL, and API integration
- Machine Learning model integration
- Responsive and modern UI
- Dashboard deployment and hosting support
- Fast delivery with clean, well-structured code
Perfect For
- Business Analytics
- Sales & Marketing Dashboards
- Financial Reports
- Data Science Projects
- Machine Learning Applications
- Research & Academic Projects
- Personal Analytics Tools
Why Choose Me?
- Clean and professional code
- Responsive and user-friendly dashboards
- Reliable communication
- On-time delivery
- Post-delivery support
- Please contact me before placing your order so we can discuss your requirements and create the best Streamlit solution for your project.