Browse categories
Explore
Fiverr Pro
English
$
USD

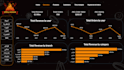
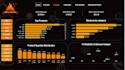
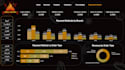

Restaurant owners don't lose money all at once. They lose it hour by hour, item by item, shift by shift and nobody sees it until the month-end report lands too late.
The real problem isn't revenue. It's the gaps nobody is measuring.
Which hours are bleeding margin? Which items look popular but kill profitability? Which days consistently underperform and why?
This dashboard answers all of it.
What it delivers:
The business case: One menu item removed based on margin data pays for this dashboard. One overstaffed shift caught early pays for this dashboard. The ROI isn't in the tool it's in the first operational decision you make with visibility you didn't have before.
Built for restaurant owners, operations managers, and F&B directors who are done running blind.
Business Intelligence Developer
Languages
I have sales data from my POS system but it's messy. Can you work with it?
Yes. POS exports are almost always messy. Tell me your system — Lightspeed, Toast, Square, or custom — and I'll assess what's usable before we start.
How is this different from the built-in reports my POS already gives me?
POS reports tell you totals. This tells you patterns — which hours, which items, which days are driving or dragging your numbers. That's a different conversation entirely.
I operate multiple branches. Can this cover all of them?
Yes. Multi-location analysis is included in the Standard and Premium packages. You'll see each branch independently and consolidated.
What does anomaly detection actually mean in practice?
It means the dashboard automatically flags when a day’s revenue is statistically unusual—either significantly higher or lower than your normal historical pattern. Instead of relying on someone to notice, the system alerts you. The data speaks first.
What if I'm not satisfied with the final delivery?
If the final delivery doesn’t align with the agreed scope, I will revise it until it does. If, after revisions, you’re still not satisfied, I offer a full refund. My goal is to ensure you feel confident and risk-free working with me.


