Browse categories
English
$
USD
Connect to your AI
Data Analyst, Power BI, SQL, Python , Excel
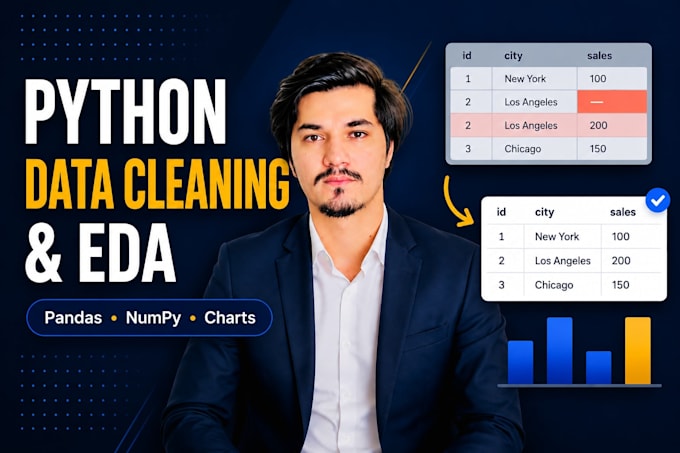
I clean messy datasets in Python (Pandas and NumPy), then explore them to show distributions, trends, relationships, and anything unusual.
What I do:
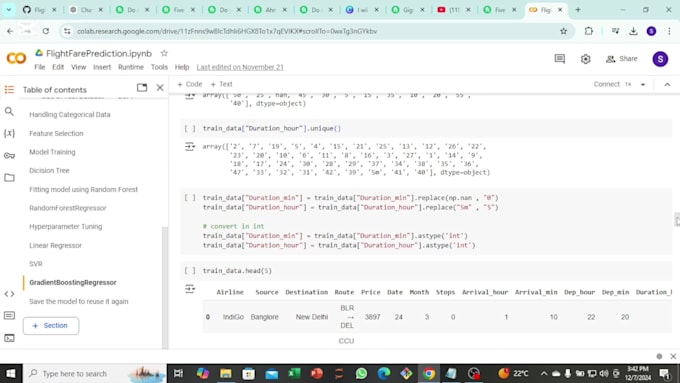
You receive a cleaned CSV or Excel file, a Jupyter Notebook (.ipynb) showing every step, and your charts as PNG files. Higher packages add a written summary, a PDF report, a change log, and a reusable cleaning script.
Optional add-on: basic machine learning (simple regression or classification with Scikit-learn). It is not in the packages and costs extra, so message me first. I will review your data before sending a custom offer.
Not included: deep learning, deployment, dashboards, and web scraping.
I am new on Fiverr, so I explain what I changed and why. Message me a small sample of your file before ordering.

_ounhds.jpg)
Technology:
Jupyter Notebook
Expertise:
Business Insights
•
Trends
•
Statistics
Programming language:
Python
Tools:
Google Colab
•
Other
What file types can you work with?
CSV, Excel (.xlsx), and JSON. For any other format, message me before ordering and I will tell you if I can open it.
How do you handle missing values and duplicates?
I check them first and tell you what I found. Then I apply the rule you choose: fill, remove, or flag. If you have no preference, I use a standard approach and explain it in the notebook.
What is exploratory data analysis (EDA)?
A first look at your data: summary statistics, distributions, groupings, correlations, and unusual values. It shows what is in the data and what needs a closer look.
What charts do I get?
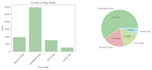
Static charts made with Matplotlib and Seaborn, such as histograms, bar charts, box plots, scatter plots, and heatmaps. They are delivered as PNG files and are not interactive dashboards.
What will I receive, and do I get the Python code?
A cleaned data file, a Jupyter Notebook with every step, and your charts. Standard adds a written summary. Premium adds a PDF report, a change log, and a reusable .py cleaning script.
Do you offer machine learning?
Yes, basic regression or classification with Scikit-learn, as a separate paid service. It is not in the packages. Message me first so I can review your data, then I will send a custom offer. I cannot promise a specific accuracy.
How large can my dataset be?
Basic: 1 file, 10,000 rows, 15 columns. Standard: 2 files, 50,000 rows, 30 columns. Premium: 3 files, 100,000 rows, 50 columns. For larger data, message me for a custom offer.
Do you offer deep learning, dashboards, or deployment?
No. This Gig covers Python cleaning, analysis, and static charts, plus basic ML as a custom service. I offer Power BI and Excel dashboards in separate Gigs.