Browse categories
Explore
Fiverr Pro
English
$
USD
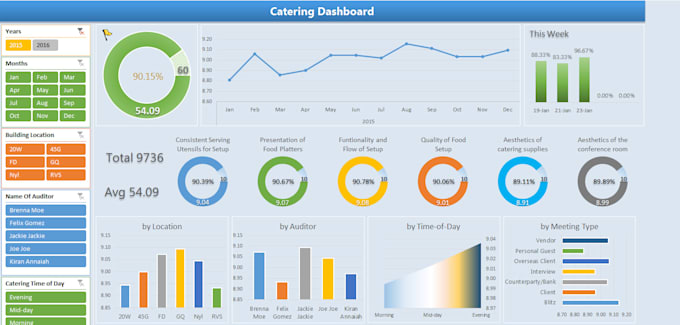
I will do Excel analysis, SQL queries and Power BI dashboard development
I provide end-to-end Excel data analysis services, where I turn your raw, unorganized, or complex data into clean, clear, and visually understandable reports.
Using Excel charts, pivot tables, formulas, and trend analysis, I help businesses and individuals uncover insights, identify patterns, and make better decisions.
I will analyze it with accuracy, structure it professionally, and present the results in a simple, meaningful, and actionable format.
Data Analysis (Basic to Advanced)
Charts & Visualization
Pivot Tables & Pivot Charts
Dashboard Creation (Premium)
Insights & Reporting
⭐ Why Choose Me?
What do you need to get started?
Just share your Excel/CSV file and tell me what type of insights or charts you need. If you're unsure, I will guide you.
Can you analyze very large datasets?
Yes. I can handle large datasets efficiently. For extremely big files, I may recommend the Standard or Premium package for deeper analysis.
Will you modify the charts or analysis if I need changes?
Absolutely! Each package includes revisions. I will make sure the final output matches your expectations.
What if I don’t know what analysis I need?
No problem. I will review your dataset and recommend the best charts, metrics, and insights based on your goals.
Do you create dashboards in Excel?
Yes! The Premium package includes a clean, interactive Excel dashboard with slicers, KPIs, and visual summaries.
Will my data remain confidential?
100%. Your data is safe and never shared with anyone. Confidentiality is guaranteed.
Can you provide same-day or urgent delivery?
Yes! I offer urgent delivery options. Contact me before ordering for availability
Do you offer custom analysis beyond the listed packages?
Yes. I can create a tailored solution based on your business needs. Send me a message to discuss.
Can you clean data before analyzing it?
Yes! If your dataset needs cleaning (duplicates, errors, formatting), I will fix it before starting the analysis.