Browse categories
Explore
Fiverr Pro
English
$
USD


I do data visualization, whether for your presentations or just for your own understanding of your data.
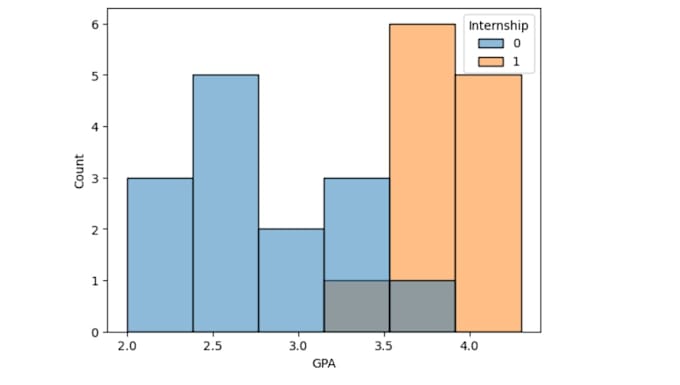
I will do excel data analysis through visualization of your data (not limited to Excel). I will create graphs/charts to display your data and its relationships/distribution, etc. I will make these using Python and libraries within Python. For example, you send me your data on animals and want me to display how common each species is through a pie chart. Or you would like a graph of your websites visitors over time, or even a projection of future visitors as well.
Data Visualization
Languages