Browse categories
Explore
Fiverr Pro
English
$
USD
Bioinformatics and Sequencing Data Analysis
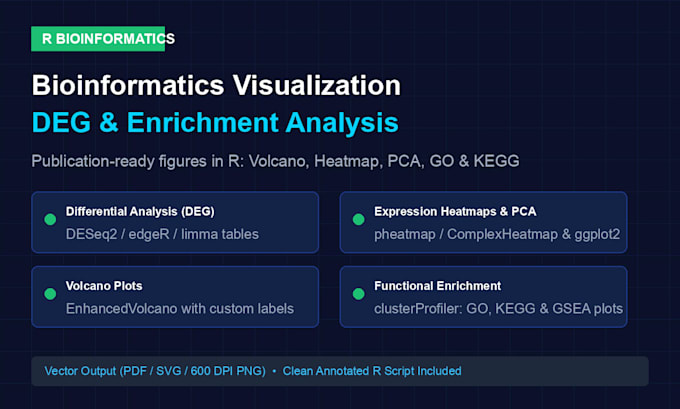
Professional bioinformatics downstream data analysis and publication-quality visualization in R.
I process raw gene expression count matrices, microarray tables, or pre-calculated DEG lists to perform rigorous statistical testing and create publication-ready figures for high-impact journals.
Packages & Pricing: - Basic ($10 / 2 days): 1 contrast DEG analysis (DESeq2/limma/edgeR). Includes Volcano plot (EnhancedVolcano), sample PCA plot, top DEG heatmap (pheatmap), summary tables and reproducible R script. - Standard ($20 / 4 days): 1 contrast DEG + Functional Enrichment. All Basic deliverables plus GO (BP/MF/CC) and KEGG pathway enrichment analysis via clusterProfiler. Dotplots, barplots and cnetplots included. - Premium ($40 / 7 days): Up to 2 contrasts DEG + GO, KEGG and GSEA enrichment. Highly customized publication figures (PDF vector & 600 DPI PNG) with color palettes, gene annotations and fully commented R script.
Input Requirements: Raw count matrix or normalized expression table with corresponding sample metadata sheet (grouping and covariates).
Scope Boundary: Downstream analysis only; research use only. Fast turnaround and clear English summary report included.

What data format do I need to provide?
Please provide an expression count matrix (raw counts for DESeq2 or normalized expression for limma) along with a sample metadata file specifying experimental conditions and biological replicates. CSV, TSV, or Excel format are all accepted.
