Browse categories
Explore
Fiverr Pro
English
$
USD


It sometimes becomes hard to interpret or read excel/CSV data. I will create charts, visualization, and graphs that will be easier to analyze and understand and spot trends in data which will help to make better decisions or see how a product is performing.
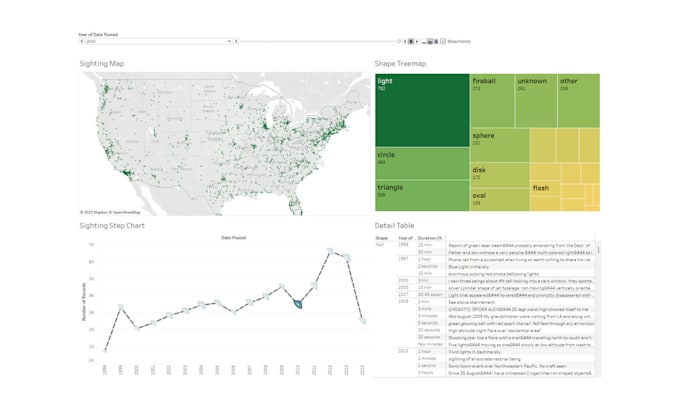
I will create an interactive dashboard for your analysis work. These dashboards will be UI-friendly and built using Tableau. The dashboard will have interactive charts which can be drilled down on detailed analysis.
Analytics Engineer
Languages