Browse categories
Explore
Fiverr Pro
English
$
USD
Computer Science Student Aspiring AI Engineer
Your GitHub repo has a story to tell. Let's read it together.
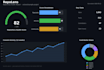
Ever wondered how "healthy" your repository actually is beyond just star count? I turn raw GitHub activity into a clear, data-backed story about your project's momentum, contributor engagement, and community health.
Using the GitHub REST API and Python (Pandas + NumPy), I pull live repo data and process it into:
I built this exact system for my own open-source analytics platform, RepoLens, so this isn't theory it's a tool I use myself, tailored to your repo.
Whether you're a maintainer trying to understand your project's pulse, a startup showcasing traction to investors, or a student who just wants really good data for a presentation I've got you covered.
Let's turn your commits into a comeback story.

Do you need admin access to my repo?
No, public repo data only, via GitHub's public API. For private repos, I'll need a read-only token.
Can you analyze multiple repos at once?
Yes, as a custom order — message me first.
What format do I get the report in?
CSV/JSON by default; PDF or chart visuals available as add-ons.
Can I get the actual Python script, not just the report?
Yes, that's included in the Premium package.


