Browse categories
Explore
Fiverr Pro
English
$
USD
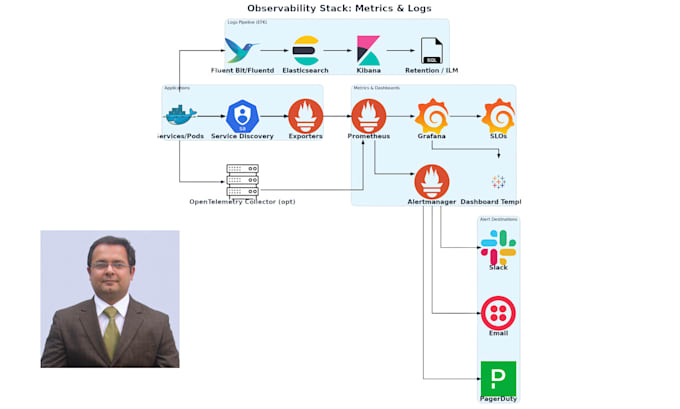
Operate confidently with actionable observability. I design and implement a production ready stack for metrics and logs: Prometheus scrapes exporters and application endpoints, Alert manager routes actionable alerts, and Grafana provides curated dashboards. For logs, we implement a Fluent Bit/Fluentd pipeline into Elasticsearch with Kibana for search and investigation. Where helpful, we add Open Telemetry collectors to standardize signals. Retention, labels, and cardinality are tuned for performance and cost. I document SLOs and alerting policies, add runbooks, and integrate notifications into your collaboration tools. Outcomes: faster MTTR, fewer false positives, and a single source of truth for platform health.
Tools & Platforms (by function):
- Metrics: Prometheus, Alert manager, Open Telemetry Collector, node/app exporters
- Dashboards: Grafana, Grafana Loki (optional for logs), Tempo/Jaeger (optional tracing)
- Logs: Fluent Bit/Fluentd, Elasticsearch/OpenSearch, Kibana
- Packaging/IaC: Helm, Kustomize, Terraform
- Notifications: Slack/Teams, Email, Webhooks, PagerDuty
- Kubernetes: EKS/AKS/GKE, KubeState Metrics, Ingress
Tools:
Docker
•
Jenkins
•
GitHub
•
Maven
•
Cloud Formation
Frameworks:
Npm
•
Terraform
•
Ansible
•
Chef
•
Puppet
Programming language:
Python
•
Java
•
JavaScript
•
Bash
Expertise:
Installation
•
Debugging
•
Configuration
Can we use OpenSearch instead of Elasticsearch?
Yes — fully supported.
Do you provide runbooks and SLOs?
Yes — we define SLOs and document response playbooks.
Will this integrate with our Kubernetes?
Yes — native exporters and Helm charts.
