Browse categories
English
$
USD
Connect to your AI





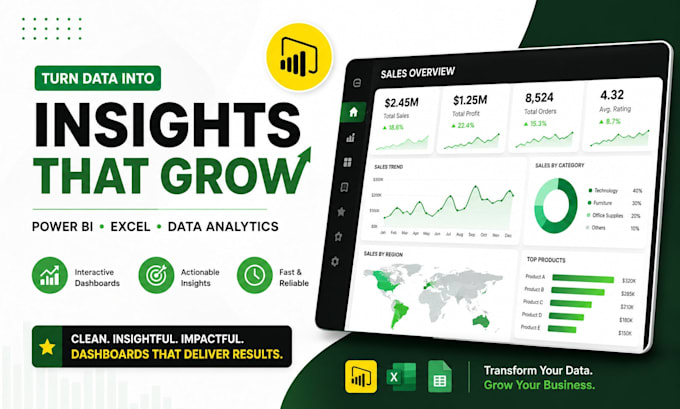
Stop Guessing. Start Growing.
Raw data is useless if it doesn't tell a story. If you are struggling to make sense of your spreadsheets, databases, or scattered metrics, you are leaving money on the table.
I don't just make pretty charts; I engineer interactive, automated data pipelines that turn your chaotic data into actionable insights.
Here is what I bring to the table:
My Tech Stack:
Why Choose Me? This isn't just basic drag-and-drop. I approach every project with a deep, technical understanding of Data Science and algorithmic efficiency. You get clean, insightful results.
Data Scientist MLOps Engineer
Languages
Can you clean and format my messy data first?
Absolutely. I handle the entire ETL (Extract, Transform, Load) process. I can clean, merge, and format messy datasets using Power Query, SQL, or Python before building the Power BI dashboard.
Do you sign NDAs for confidential data?
Yes. I take data privacy very seriously and am happy to sign an NDA before you share any internal business data.
Will the dashboard update automatically?
Yes, if your data source is connected to a live database or a continuously updated cloud file (like SharePoint or Google Sheets), I can set up scheduled refreshes in Power BI.