Looks Like This Service Is On Hold

I will create interactive visualizations using power bi,excel,and python

S
sheikhspere
S
sheikhspere
Furqan

About this gig

Welcome! Looking to transform your data into powerful insights and visually compelling presentations? You're in the right place.

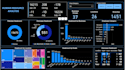
With a strong background in data analysis and visualization, I specialize in creating interactive and visually impactful dashboards using Power BI, Excel, and Python. Here's how I can elevate your data:

  • Data Cleaning & Preparation: I ensure your data is meticulously organized and ready for accurate, meaningful analysis.
  • Customized Visualizations: From bar charts to complex dashboards, I tailor each visualization to align with your specific goals and audience needs.
  • Dynamic, Interactive Dashboards: I design user-friendly dashboards that allow you to explore data intuitively, empowering you to make informed, strategic decisions.
  • Clear & Effective Insights Presentation: My reports and dashboards make complex data easy to understand and share, ensuring your team can quickly grasp and act on key insights.

Lets work together to bring your data to life with visuals that tell a story. Contact me to discuss your project needs before placing an order look forward to helping you achieve data-driven success!

Thank you!

Get to know Furqan

Furqan

Dedicated Statistician with expertise in data analysis

  • FromPakistan
  • Member sinceJan 2019
  • Languages

    Urdu, Punjabi, English
I am Furqan, a professional statistician with a strong foundation in mathematics and a specialization in data analysis. I am proficient in a range of analytical tools, including R, Python, SPSS, and Power BI, which I use for statistical modeling, data visualization, and in-depth analysis. Additionally, I have expertise in MS Excel for advanced data manipulation, With a meticulous approach and a commitment to delivering actionable insights, I am dedicated to using data to support informed decision-making and strategic planning.