Browse categories
English
$
USD
Connect to your AI


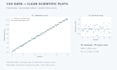
Turn a small CSV dataset into clear charts and a repeatable Python workflow.
I am a Physics PhD student working in computational physics. I can help prepare numeric data, check missing or duplicate entries, and create clear, labeled scientific plots.
This package covers one CSV file up to 10,000 rows and 10 columns, with up to three agreed static charts. You receive cleaned data, a cleaning log where relevant, PNG and SVG figures, the Python script, and run instructions.
I use AI-assisted tools and verify the code and outputs. Please share the column definitions, units, chart requirements, and acceptance criteria. Any model fitting or unusual data format must be agreed before work. Additional data, new analyses, dashboards, and new requirements need a separate scope.
The gallery is a synthetic demonstration, not past client work.
Scientific Data Plotting and Python Scripts
Languages
What is included in one revision?
Corrections or adjustments to the agreed charts, labels, colors, and cleaning rules for the same dataset. A new dataset or new analysis is a new scope.
Do you use AI?
Yes, AI-assisted tools help with coding. I run the code, inspect results, and deliver reproducible source and instructions.
Is the gallery real client work?
No. It is an original demonstration with explicitly labeled synthetic data, not past client work or research results.
