Browse categories
Explore
Fiverr Pro
English
$
USD
“Hey, ik ben op vakantie. Ik kijk er naar uit om met je aan de slag te gaan als ik weer terug ben!”
You can still contact the seller.

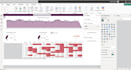

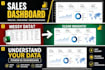

I help businesses turn raw data into clear KPI dashboards for smarter decisions.
I specialize in turning Excel, CSV, or database data into clear, interactive dashboards with actionable insights.
Services include:
Whether you need a sales dashboard, marketing insights, or performance tracking, I create dashboards that are easy to use and focused on what matters.
Power BI Reporting Specialist
Languages
Is my data confidential?
Yes, all data and information are treated as strictly confidential.
What do you need to get started?
I need your data files (Excel/CSV/database access), requirements, and expected KPIs or goals.
Can you update or fix an existing dashboard?
Yes, I can improve, fix, or optimize your current Power BI or Excel dashboard.
Which data sources do you support?
I work with Excel, CSV, SQL databases, APIs, and other common data sources.
Can you clean and transform my data?
Yes, I can clean, structure, and prepare your data for accurate analysis and reporting.
Do you create custom dashboards?
Yes, every dashboard is fully customized to your business needs and goals.
Will my dashboard be interactive?
Yes, I build interactive dashboards with filters, slicers, and drill-down capabilities.
Do you use DAX and data modeling?
Yes, I create calculated measures, KPIs, and optimized data models when needed.
Do you provide revisions?
Yes, revisions depend on the package you choose.


