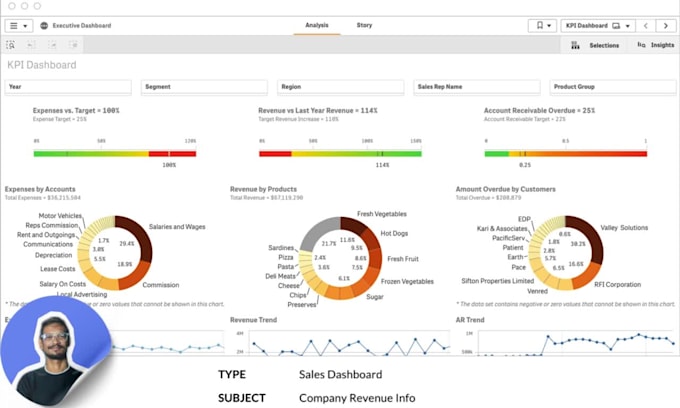
I will create a financial dashboard in power bi, tableau, and qlik sense

S
soumenbasak
S
soumenbasak
Soumen B

About this gig

Data Visualization and Analytics specialist in Tableau & Qlik Sense.


About Me

With over 2 of experience in data analytics from HSBC, I specialize in crafting custom dashboards and accurate data models tailored to your unique needs. I have worked with diverse industries to bring clarity and efficiency to their data processes.


Experience in BI Tools like Tableau, Power BI, Qlik Sense and excel.


Why Choose Me?

  • I can Create Bar charts, Line charts, Scatter plots, Map using geographic data, Text table, Heat maps, Highlight tables, donut chart, gauge chart, waterfall chart, dual axis charts and all type of advanced charts in Tableau.
  • Unlimited Revisions until client is satisfied
  • I can Create Interactive Tableau Dashboards and Storyboards
  • I can do Data Preparation, Joining and Blending or Cross database joins.


What Will You Get?

  • Customized, interactive dashboards that reveal trends
  • Clean and accurate data models for precise forecasting
  • Easy-to-use reporting tools to monitor KPIs
  • Full support and guidance to maximize your data's potential


Drop me a message!

Let's bring life to your Data!

Get to know Soumen B

Soumen B

Linux System Administrator, Business Analyst

3.3(1)
  • FromIndia
  • Member sinceJun 2017
  • Last delivery6 years
  • Languages

    English, Hindi
For the past 3 years, I have worked for HSBC in the Banking industry. I'm an expert in server management and Linux system administration and data visualization. I am dedicated, passionate and constantly evolving. Ready for business.