Browse categories
Explore
Fiverr Pro
English
$
USD


Is your business data scattered across files with no clear picture of performance?
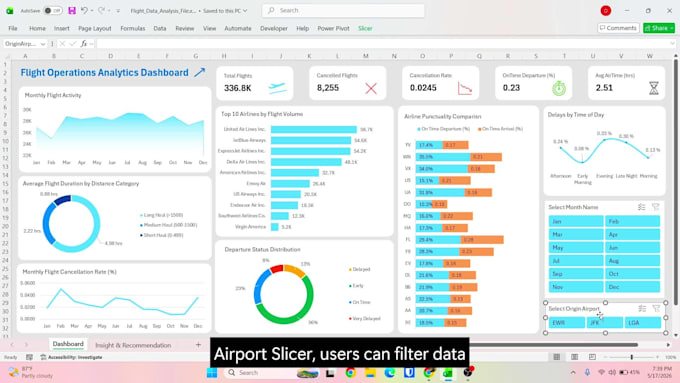
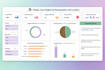
I will build a dynamic Excel KPI dashboard that turns your raw data into an interactive, decision-ready report.
Using Power Query, Power Pivot, and DAX, I clean your data, build a structured data model, and deliver a fully interactive dashboard with KPI cards, pivot charts, and slicers - plus written business insights and recommendations.
What I will do:
Tools:
Why choose me:
Before placing an order, please send me a message first. Share your data and tell me what you need to track. I will confirm the scope and make sure we are aligned before we start.
Excel Data and KPI Dashboard Specialist
Languages
What files or data do I need to share with you to get started?
Share your data in Excel (.xlsx), CSV, or PDF format. If it is spread across multiple files, zip them together. Send me a message first and I will review your file before you place an order.
My data is messy and unorganised. Can you still build a dashboard from it?
Yes. Data cleaning is the first step before I build anything. I use Power Query to remove duplicates, fix formats, and structure your data properly before the dashboard is built.
Will the dashboard still work when I add new data next month?
Yes. The dashboard is fully refreshable. When you add new data to your source file and click Refresh, all KPI cards, charts, and pivot tables update automatically.
Do you offer custom pricing based on project requirements?
Yes. If your project requires larger datasets, more data sources, or advanced modeling, please message me first with your details. I can review the requirements and send a custom offer based on the project scope.
Will you provide more than 1 dashboard?
Yes. I usually recommend 1 interactive dashboard for better Excel performance and usability, but if your dataset requires multiple dashboard tabs, they can be included in the Premium package.
Can you connect data from multiple files or sources?
Yes. Standard handles up to 2 sources and Premium handles up to 4. Multiple files are merged and cleaned using Power Query before building the data model.
What Excel version do I need to use the dashboard?
Excel 2019, Excel 2021, Excel 2024, or Microsoft 365. Microsoft 365 is recommended for the best experience with Power Query and Power Pivot features.