Browse categories
Explore
Fiverr Pro
English
$
USD


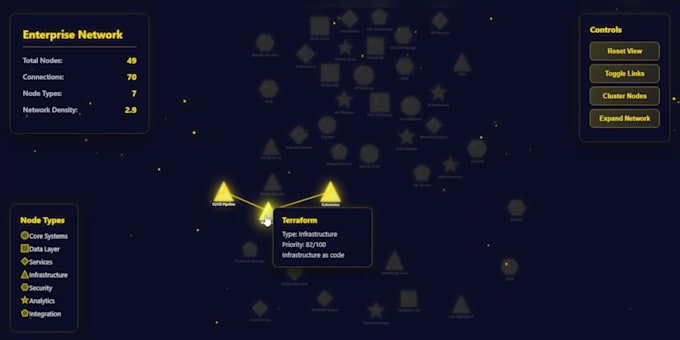
Looking to bring your data to life? I specialize in creating interactive and dynamic data visualizations using D3.js, built from the ground up with vanilla JavaScript, HTML, and CSS and easily integrated into React.js or TypeScript projects.
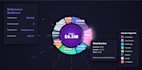
Whether you need a dashboard, infographic, or web visualization, I can craft visuals that tell your datas story beautifully. From pie charts, bar and area graphs to collapsible trees, scatter plots, choropleths, and force layout graphs, I make complex information easy to understand and engaging to explore.
Not sure which visualization fits your data best? Ill guide you in choosing the right approach that highlights your insights perfectly.
Check out the sample dashboard videos I have attached to see the kind of interactive, visually appealing experiences I can build for you.
(Note: The listed prices are just for reference feel free to contact me to discuss your projects specifics.)
Languages