Browse categories
English
$
USD
Connect to your AI

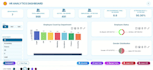
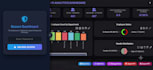

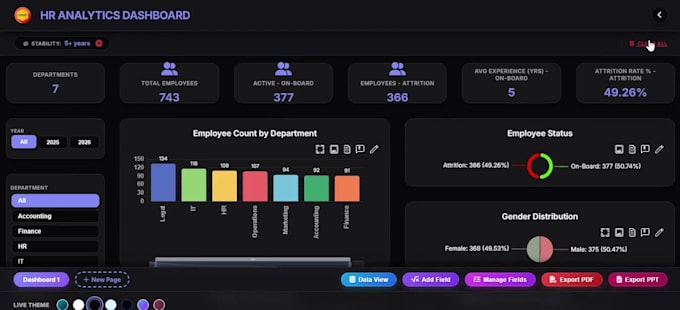
Turn Your Excel Data into an Interactive HTML Dashboard!
Transform static Excel reports into modern dashboards to track KPIs, analyze performance, and make better business decisions.
WHAT I OFFER
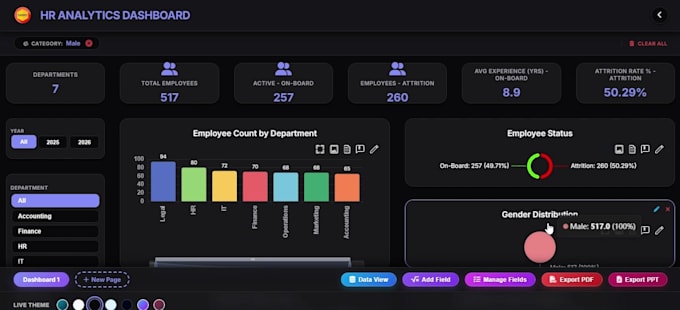
Interactive HTML dashboards from Excel
KPI cards, charts, and summary tables
Filters by date, region, or category
Sales, HR, Finance, Inventory, and Operations analytics
Target vs. Achievement tracking
Custom branding and dark/light themes
Responsive desktop and mobile layouts
PDF/PPT export and data refresh, where supported
WHY CHOOSE ME?
Professional, user-friendly design
Customized business solutions
Interactive reports that reduce manual work
Clear communication and reliable delivery
HOW IT WORKS
DELIVERY INCLUDES
Interactive HTML dashboard
Agreed KPIs, charts, and filters
Package-based features and revisions
Contact me before ordering complex projects.
Let's turn your data into actionable insights!
Excel Dashboard and Data Visualization Specialist
Languages
What is an interactive HTML dashboard?
It is a browser-based dashboard with interactive charts, KPI cards, filters, and other features that make business reporting easier to explore.
Can you create a dashboard from my existing Excel file?
Yes. I can use your Excel data as the source, subject to the workbook structure, data quality, and project requirements.
Can I open the dashboard on a mobile phone or laptop?
Yes. I can build a responsive layout for supported modern browsers. Some complex tables or charts may need a different layout on smaller screens.
Can I password-protect the dashboard?
A password screen can be included.
Can I export the dashboard to PDF or PowerPoint?
I can implement agreed PDF and PowerPoint export options. The output and export behavior will depend on the dashboard design and technical requirements.
Do you provide online hosting?
Hosting can be discussed as an additional service. Please contact me to confirm the hosting environment, access requirements, and ongoing costs.
Can you work with large Excel files or multiple sheets?
Yes, subject to a review of the file size, number of records, relationships, and calculations. Please share a sample before placing an order.
Can you match my company branding?
Yes. Share your logo, preferred colors, and any design references.
Should I contact you before ordering?
Yes, especially if your project requires multiple pages, automated data refresh, online access, user-level permissions, or complex calculations. I will help confirm the appropriate package and scope.